| Red | Green | Blue | |
| z | 17.64 | ||
| znorm | Inf | ||
| sky | -NaN | -Inf | -Inf |
| S/N | 26.5 | 47.4 | 50.7 |
| S/N(c) | 0.0 | 0.0 | 0.0 |
| SN(E/C) |
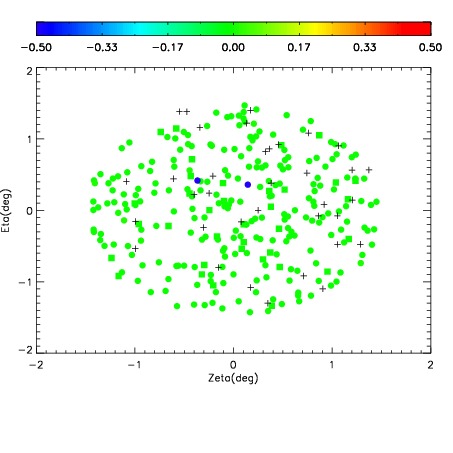
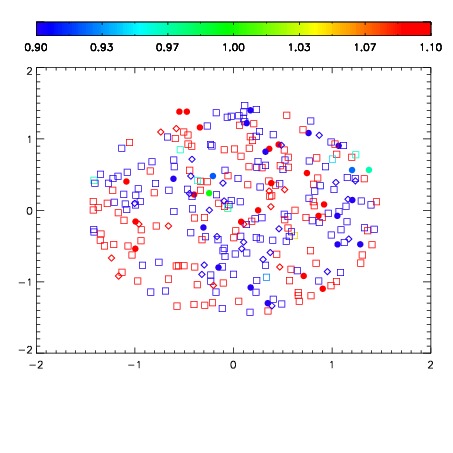
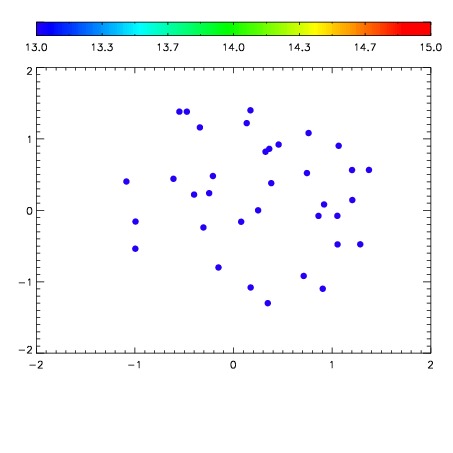

| Frame | Nreads | Zeropoints | Mag plots | Spatial mag deviation | Spatial sky 16325A emission deviations (filled: sky, open: star) | Spatial sky continuum emission | Spatial sky telluric CO2 absorption deviations (filled: H < 10) | |||||||||||||||||||||||
| 0 | 0 |
|
|
|
|
|
|
| IPAIR | NAME | SHIFT | NEWSHIFT | S/N | NAME | SHIFT | NEWSHIFT | S/N |
| 0 | 11410094 | 0.481900 | 0.00000 | 18.8564 | 11410096 | -0.00180419 | 0.483704 | 18.9030 |
| 1 | 11410098 | 0.480810 | 0.00109002 | 18.9904 | 11410092 | -0.00123818 | 0.483138 | 18.9735 |
| 2 | 11410091 | 0.480364 | 0.00153601 | 18.9674 | 11410097 | -0.00132647 | 0.483226 | 18.9454 |
| 3 | 11410095 | 0.481734 | 0.000165999 | 18.9358 | 11410093 | -0.00140045 | 0.483300 | 18.9198 |
| 4 | 11410090 | 0.479773 | 0.00212699 | 18.8150 | 11410089 | 0.00000 | 0.481900 | 18.6602 |