| Red | Green | Blue | |
| z | 17.64 | ||
| znorm | Inf | ||
| sky | -Inf | -Inf | -NaN |
| S/N | 23.4 | 40.6 | 43.0 |
| S/N(c) | 0.0 | 0.0 | 0.0 |
| SN(E/C) |
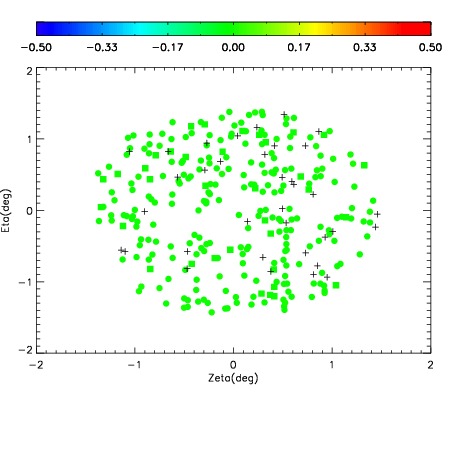
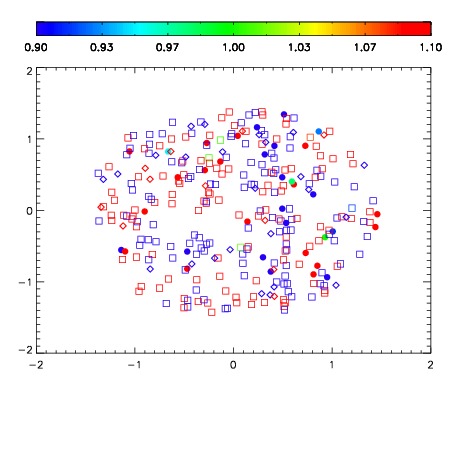
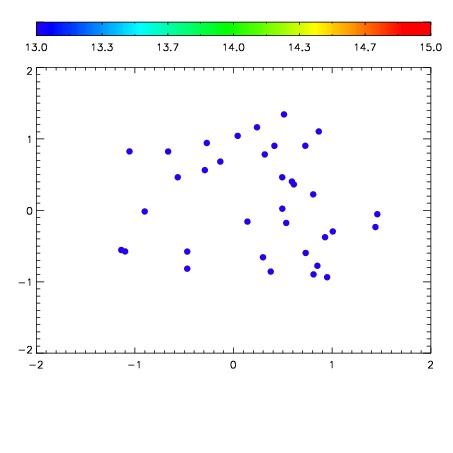

| Frame | Nreads | Zeropoints | Mag plots | Spatial mag deviation | Spatial sky 16325A emission deviations (filled: sky, open: star) | Spatial sky continuum emission | Spatial sky telluric CO2 absorption deviations (filled: H < 10) | |||||||||||||||||||||||
| 0 | 0 |
|
|
|
|
|
|
| IPAIR | NAME | SHIFT | NEWSHIFT | S/N | NAME | SHIFT | NEWSHIFT | S/N |
| 0 | 11480013 | 0.481515 | 0.00000 | 19.0215 | 11480015 | -0.000290798 | 0.481806 | 19.0746 |
| 1 | 11480016 | 0.479931 | 0.00158399 | 19.1213 | 11480014 | -0.000227574 | 0.481743 | 19.0913 |
| 2 | 11480012 | 0.479950 | 0.00156498 | 19.0198 | 11480011 | 0.00000 | 0.481515 | 19.0094 |