| Red | Green | Blue | |
| z | 17.64 | ||
| znorm | Inf | ||
| sky | -Inf | -Inf | -NaN |
| S/N | 17.2 | 30.0 | 32.8 |
| S/N(c) | 0.0 | 0.0 | 0.0 |
| SN(E/C) |
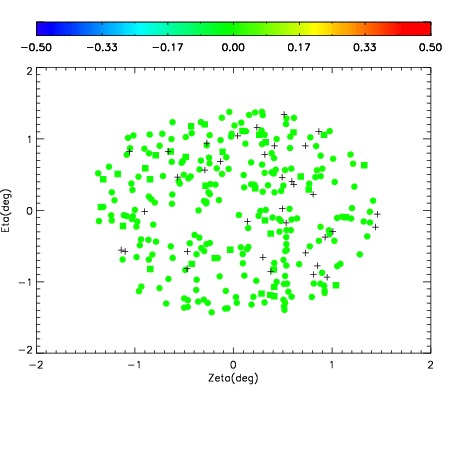
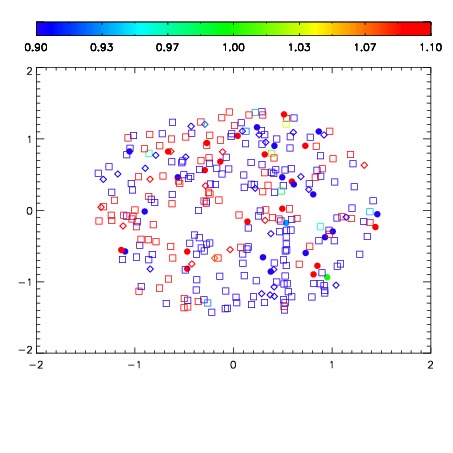
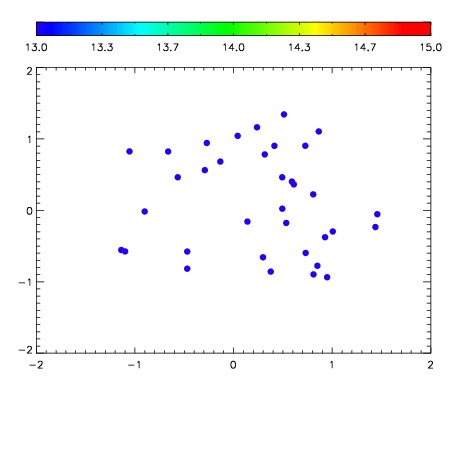

| Frame | Nreads | Zeropoints | Mag plots | Spatial mag deviation | Spatial sky 16325A emission deviations (filled: sky, open: star) | Spatial sky continuum emission | Spatial sky telluric CO2 absorption deviations (filled: H < 10) | |||||||||||||||||||||||
| 0 | 0 |
|
|
|
|
|
|
| IPAIR | NAME | SHIFT | NEWSHIFT | S/N | NAME | SHIFT | NEWSHIFT | S/N |
| 0 | 11760049 | 0.494813 | 0.00000 | 18.3298 | 11760047 | -0.00105608 | 0.495869 | 18.6131 |
| 1 | 11760048 | 0.494311 | 0.000501990 | 18.3041 | 11760046 | -0.00132202 | 0.496135 | 18.5144 |
| 2 | 11760052 | 0.494538 | 0.000274986 | 18.3024 | 11760051 | -0.00179265 | 0.496606 | 18.2493 |
| 3 | 11760045 | 0.494737 | 7.59959e-05 | 18.1167 | 11760050 | -0.00202278 | 0.496836 | 18.1963 |
| 4 | 11760044 | 0.494178 | 0.000634998 | 17.9572 | 11760043 | 0.00000 | 0.494813 | 18.1758 |