| Red | Green | Blue | |
| z | 17.64 | ||
| znorm | Inf | ||
| sky | -Inf | -NaN | -NaN |
| S/N | 26.7 | 44.7 | 47.8 |
| S/N(c) | 0.0 | 0.0 | 0.0 |
| SN(E/C) |
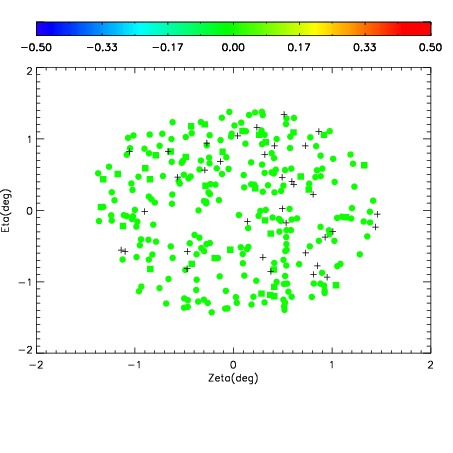
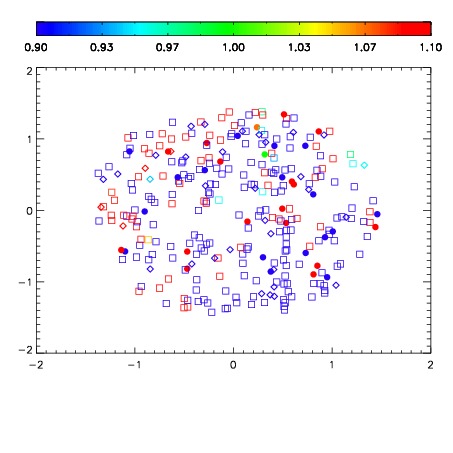
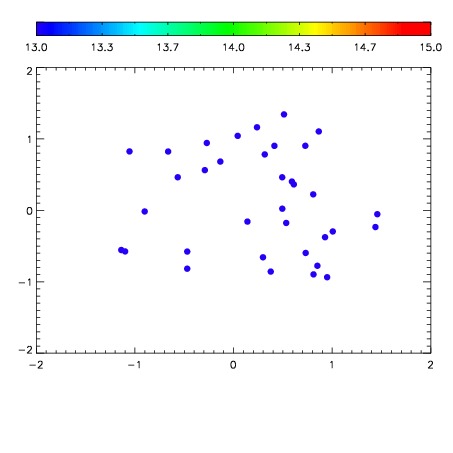

| Frame | Nreads | Zeropoints | Mag plots | Spatial mag deviation | Spatial sky 16325A emission deviations (filled: sky, open: star) | Spatial sky continuum emission | Spatial sky telluric CO2 absorption deviations (filled: H < 10) | |||||||||||||||||||||||
| 0 | 0 |
|
|
|
|
|
|
| IPAIR | NAME | SHIFT | NEWSHIFT | S/N | NAME | SHIFT | NEWSHIFT | S/N |
| 0 | 11830012 | 0.496790 | 0.00000 | 18.8944 | 11830017 | -0.00229386 | 0.499084 | 18.8791 |
| 1 | 11830015 | 0.492658 | 0.00413200 | 19.1384 | 11830013 | -0.00226122 | 0.499051 | 19.1220 |
| 2 | 11830016 | 0.492663 | 0.00412700 | 19.0090 | 11830014 | -0.00191427 | 0.498704 | 19.0637 |
| 3 | 11830011 | 0.495702 | 0.00108799 | 18.7776 | 11830010 | 0.00000 | 0.496790 | 18.8553 |