| Red | Green | Blue | |
| z | 17.64 | ||
| znorm | Inf | ||
| sky | -Inf | -NaN | -Inf |
| S/N | 21.0 | 36.6 | 39.2 |
| S/N(c) | 0.0 | 0.0 | 0.0 |
| SN(E/C) |

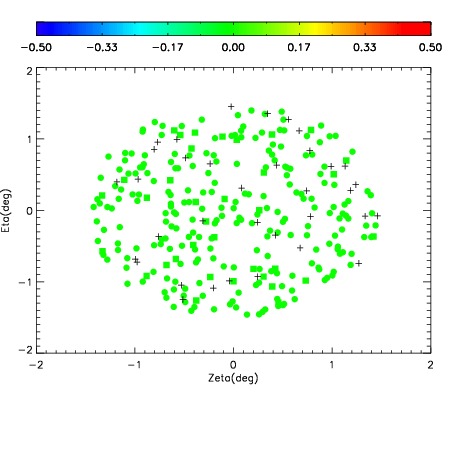
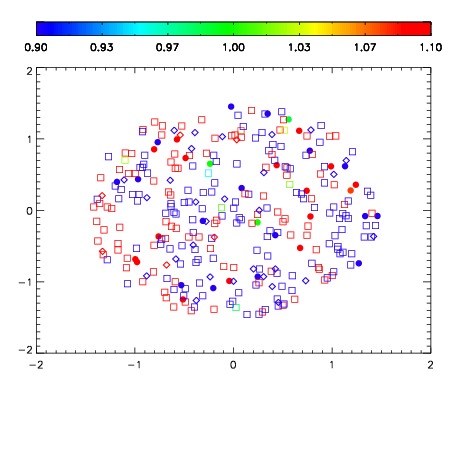


| Frame | Nreads | Zeropoints | Mag plots | Spatial mag deviation | Spatial sky 16325A emission deviations (filled: sky, open: star) | Spatial sky continuum emission | Spatial sky telluric CO2 absorption deviations (filled: H < 10) | |||||||||||||||||||||||
| 0 | 0 |
|
|
|
|
|
|
| IPAIR | NAME | SHIFT | NEWSHIFT | S/N | NAME | SHIFT | NEWSHIFT | S/N |
| 0 | 08690017 | 0.474588 | 0.00000 | 18.5643 | 08690018 | -0.00331443 | 0.477902 | 18.7068 |
| 1 | 08690013 | 0.471561 | 0.00302699 | 18.8953 | 08690015 | 0.00145100 | 0.473137 | 18.8573 |
| 2 | 08690012 | 0.470778 | 0.00381002 | 18.8791 | 08690011 | 0.00000 | 0.474588 | 18.8331 |
| 3 | 08690016 | 0.474345 | 0.000243008 | 18.8163 | 08690014 | 0.00189773 | 0.472690 | 18.8108 |