| Red | Green | Blue | |
| z | 17.64 | ||
| znorm | Inf | ||
| sky | -NaN | -NaN | -Inf |
| S/N | 20.7 | 37.7 | 40.8 |
| S/N(c) | 0.0 | 0.0 | 0.0 |
| SN(E/C) |

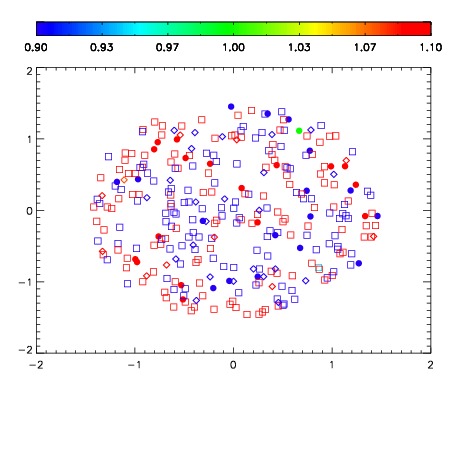


| Frame | Nreads | Zeropoints | Mag plots | Spatial mag deviation | Spatial sky 16325A emission deviations (filled: sky, open: star) | Spatial sky continuum emission | Spatial sky telluric CO2 absorption deviations (filled: H < 10) | |||||||||||||||||||||||
| 0 | 0 |
|
|
|
|
|
|
| IPAIR | NAME | SHIFT | NEWSHIFT | S/N | NAME | SHIFT | NEWSHIFT | S/N |
| 0 | 11440081 | 0.475500 | 0.00000 | 19.0122 | 11440082 | -0.00391874 | 0.479419 | 18.9834 |
| 1 | 11440085 | 0.475185 | 0.000314981 | 19.0574 | 11440079 | 0.00000 | 0.475500 | 19.0464 |
| 2 | 11440084 | 0.475215 | 0.000285000 | 19.0274 | 11440083 | -0.00402833 | 0.479528 | 18.9959 |
| 3 | 11440080 | 0.474924 | 0.000575989 | 18.9602 | 11440086 | -0.000826416 | 0.476326 | 18.9404 |