| Red | Green | Blue | |
| z | 17.64 | ||
| znorm | Inf | ||
| sky | -NaN | -NaN | -Inf |
| S/N | 23.3 | 39.9 | 42.0 |
| S/N(c) | 0.0 | 0.0 | 0.0 |
| SN(E/C) |
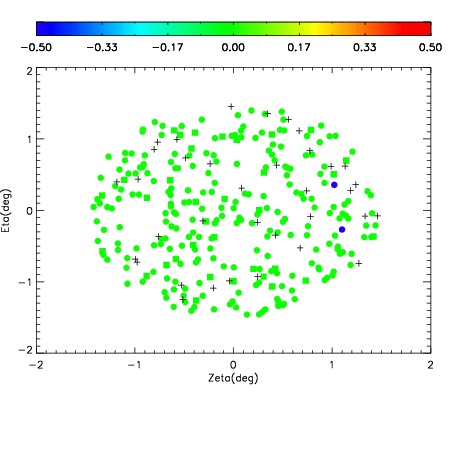
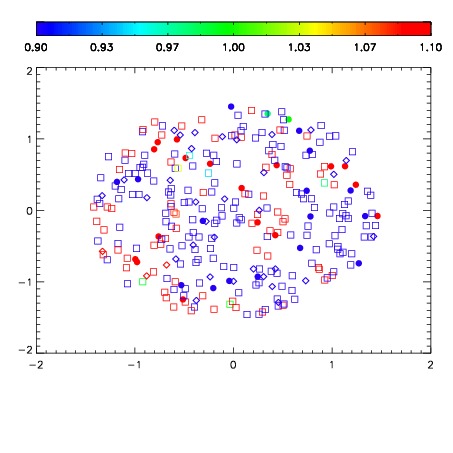
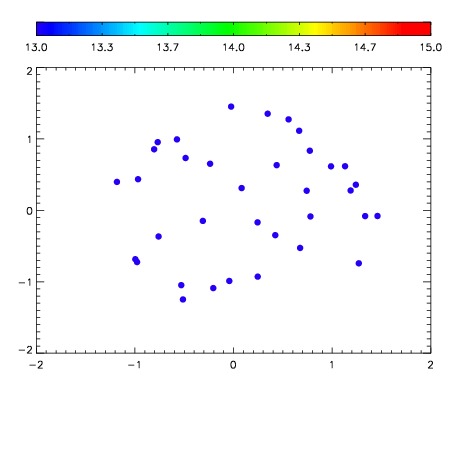

| Frame | Nreads | Zeropoints | Mag plots | Spatial mag deviation | Spatial sky 16325A emission deviations (filled: sky, open: star) | Spatial sky continuum emission | Spatial sky telluric CO2 absorption deviations (filled: H < 10) | |||||||||||||||||||||||
| 0 | 0 |
|
|
|
|
|
|
| IPAIR | NAME | SHIFT | NEWSHIFT | S/N | NAME | SHIFT | NEWSHIFT | S/N |
| 0 | 11710098 | 0.487836 | 0.00000 | 19.0204 | 11710099 | -0.00222781 | 0.490064 | 19.0153 |
| 1 | 11710094 | 0.485830 | 0.00200599 | 19.0324 | 11710096 | -0.00204238 | 0.489878 | 19.0345 |
| 2 | 11710097 | 0.486983 | 0.000853002 | 19.0053 | 11710095 | -0.00211390 | 0.489950 | 19.0059 |
| 3 | 11710093 | 0.485528 | 0.00230801 | 18.9785 | 11710092 | 0.00000 | 0.487836 | 18.9593 |