| Red | Green | Blue | |
| z | 17.64 | ||
| znorm | Inf | ||
| sky | -Inf | -Inf | -Inf |
| S/N | 22.3 | 38.1 | 41.5 |
| S/N(c) | 0.0 | 0.0 | 0.0 |
| SN(E/C) |
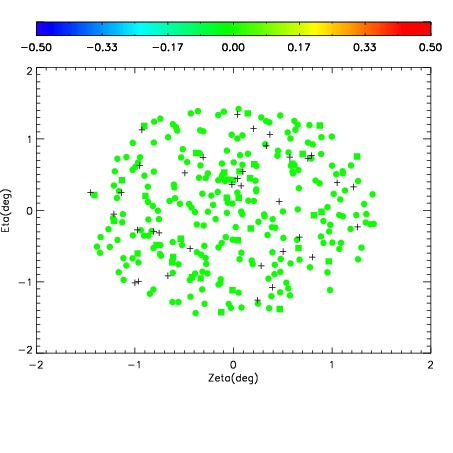
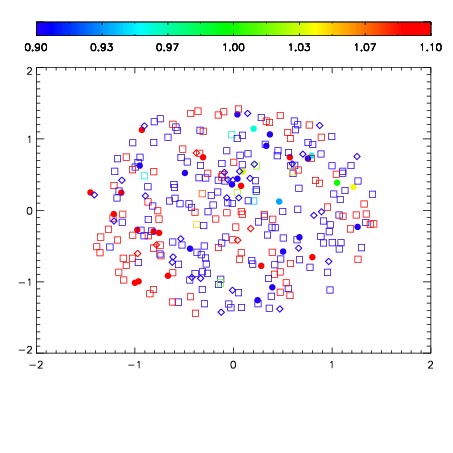
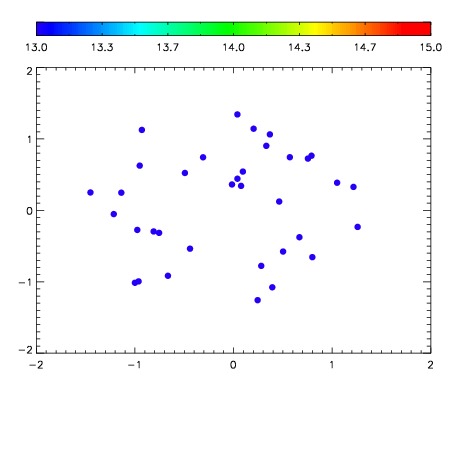

| Frame | Nreads | Zeropoints | Mag plots | Spatial mag deviation | Spatial sky 16325A emission deviations (filled: sky, open: star) | Spatial sky continuum emission | Spatial sky telluric CO2 absorption deviations (filled: H < 10) | |||||||||||||||||||||||
| 0 | 0 |
|
|
|
|
|
|
| IPAIR | NAME | SHIFT | NEWSHIFT | S/N | NAME | SHIFT | NEWSHIFT | S/N |
| 0 | 08460096 | 0.487981 | 0.00000 | 18.8570 | 08460098 | 0.000822620 | 0.487158 | 18.8769 |
| 1 | 08460099 | 0.483324 | 0.00465700 | 18.9285 | 08460097 | 0.00396232 | 0.484019 | 18.8850 |
| 2 | 08460100 | 0.484849 | 0.00313199 | 18.8539 | 08460094 | 0.00000 | 0.487981 | 18.8103 |
| 3 | 08460095 | 0.485039 | 0.00294200 | 18.8314 | 08460101 | 0.00155434 | 0.486427 | 18.6017 |