| Red | Green | Blue | |
| z | 17.64 | ||
| znorm | Inf | ||
| sky | -Inf | -Inf | -NaN |
| S/N | 13.4 | 25.1 | 26.0 |
| S/N(c) | 0.0 | 0.0 | 0.0 |
| SN(E/C) |
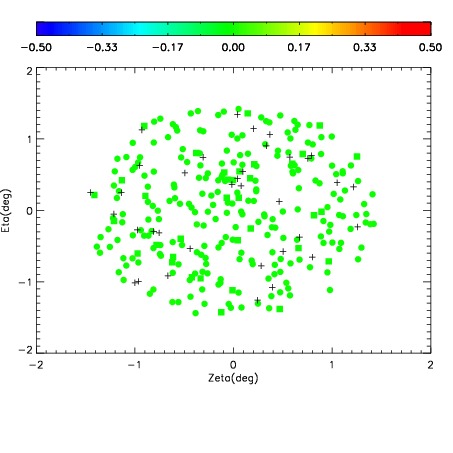
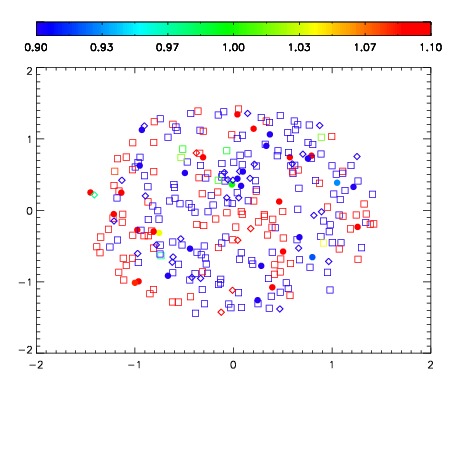
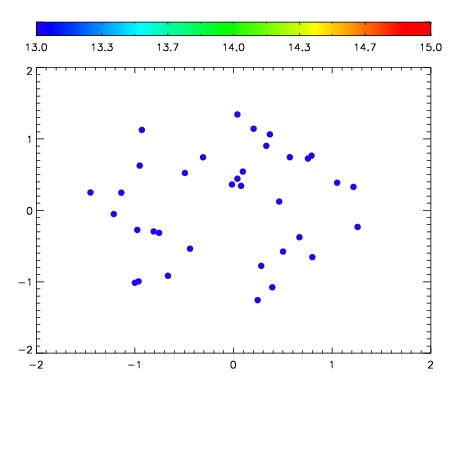

| Frame | Nreads | Zeropoints | Mag plots | Spatial mag deviation | Spatial sky 16325A emission deviations (filled: sky, open: star) | Spatial sky continuum emission | Spatial sky telluric CO2 absorption deviations (filled: H < 10) | |||||||||||||||||||||||
| 0 | 0 |
|
|
|
|
|
|
| IPAIR | NAME | SHIFT | NEWSHIFT | S/N | NAME | SHIFT | NEWSHIFT | S/N |
| 0 | 08710028 | 0.475710 | 0.00000 | 17.7135 | 08710025 | 0.00420658 | 0.471503 | 18.0746 |
| 1 | 08710023 | 0.474137 | 0.00157300 | 18.2760 | 08710029 | 0.00337949 | 0.472331 | 18.4043 |
| 2 | 08710024 | 0.474914 | 0.000795990 | 17.9581 | 08710022 | 0.00000 | 0.475710 | 18.3544 |
| 3 | 08710027 | 0.475692 | 1.80006e-05 | 17.9571 | 08710026 | 0.00455107 | 0.471159 | 18.3092 |