| Red | Green | Blue | |
| z | 17.64 | ||
| znorm | Inf | ||
| sky | -NaN | -NaN | -NaN |
| S/N | 24.9 | 45.4 | 47.4 |
| S/N(c) | 0.0 | 0.0 | 0.0 |
| SN(E/C) |
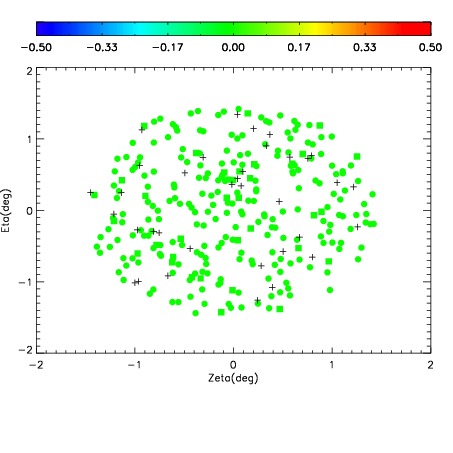
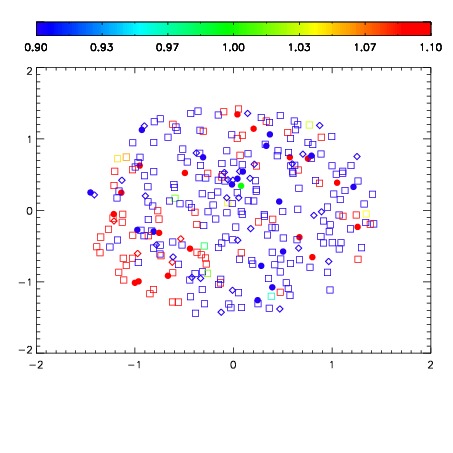
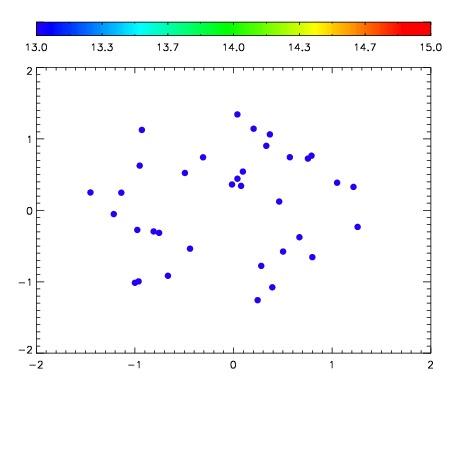

| Frame | Nreads | Zeropoints | Mag plots | Spatial mag deviation | Spatial sky 16325A emission deviations (filled: sky, open: star) | Spatial sky continuum emission | Spatial sky telluric CO2 absorption deviations (filled: H < 10) | |||||||||||||||||||||||
| 0 | 0 |
|
|
|
|
|
|
| IPAIR | NAME | SHIFT | NEWSHIFT | S/N | NAME | SHIFT | NEWSHIFT | S/N |
| 0 | 11600012 | 0.486612 | 0.00000 | 18.9481 | 11600011 | 0.00000 | 0.486612 | 19.0018 |
| 1 | 11600016 | 0.485040 | 0.00157198 | 19.0792 | 11600018 | -0.00174481 | 0.488357 | 19.0780 |
| 2 | 11600013 | 0.486378 | 0.000233978 | 19.0630 | 11600015 | -0.00283947 | 0.489451 | 19.0469 |
| 3 | 11600017 | 0.484554 | 0.00205800 | 19.0026 | 11600014 | -0.00267741 | 0.489289 | 19.0242 |