| Red | Green | Blue | |
| z | 17.64 | ||
| znorm | Inf | ||
| sky | -Inf | -NaN | -Inf |
| S/N | 16.6 | 31.8 | 32.7 |
| S/N(c) | 0.0 | 0.0 | 0.0 |
| SN(E/C) |
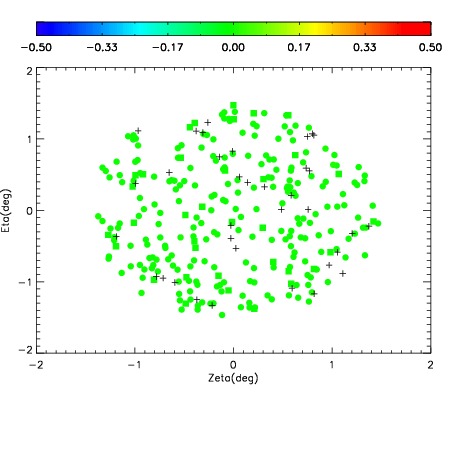
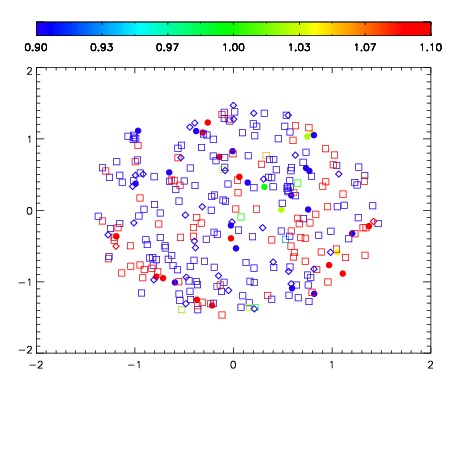
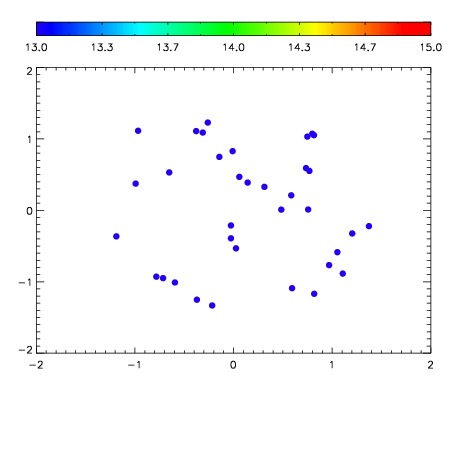

| Frame | Nreads | Zeropoints | Mag plots | Spatial mag deviation | Spatial sky 16325A emission deviations (filled: sky, open: star) | Spatial sky continuum emission | Spatial sky telluric CO2 absorption deviations (filled: H < 10) | |||||||||||||||||||||||
| 0 | 0 |
|
|
|
|
|
|
| IPAIR | NAME | SHIFT | NEWSHIFT | S/N | NAME | SHIFT | NEWSHIFT | S/N |
| 0 | 08710017 | 0.475976 | 0.00000 | 18.2990 | 08710018 | 0.00214447 | 0.473832 | 18.2460 |
| 1 | 08710016 | 0.474881 | 0.00109500 | 18.5356 | 08710011 | 0.00000 | 0.475976 | 18.6900 |
| 2 | 08710013 | 0.474429 | 0.00154698 | 18.4681 | 08710014 | -0.000199437 | 0.476175 | 18.5507 |
| 3 | 08710012 | 0.473646 | 0.00233001 | 18.4149 | 08710015 | 0.000145781 | 0.475830 | 18.3683 |