| Red | Green | Blue | |
| z | 17.64 | ||
| znorm | Inf | ||
| sky | -Inf | -Inf | -Inf |
| S/N | 26.6 | 45.5 | 49.8 |
| S/N(c) | 0.0 | 0.0 | 0.0 |
| SN(E/C) |
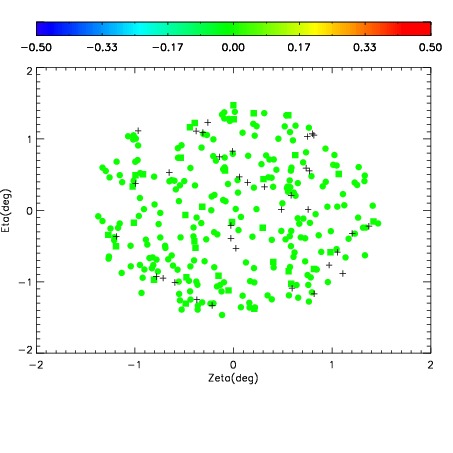
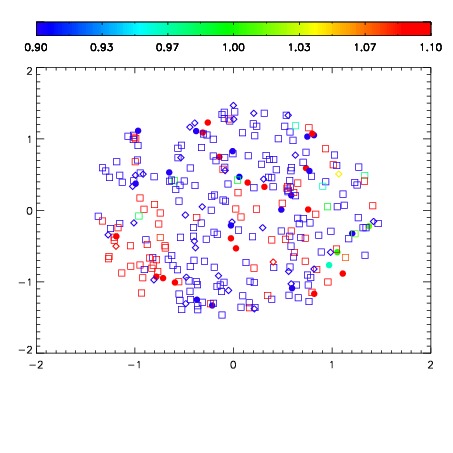
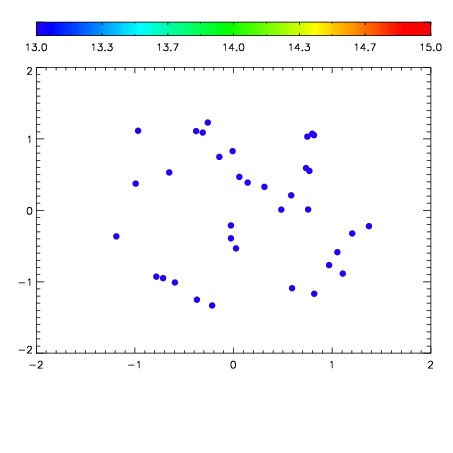

| Frame | Nreads | Zeropoints | Mag plots | Spatial mag deviation | Spatial sky 16325A emission deviations (filled: sky, open: star) | Spatial sky continuum emission | Spatial sky telluric CO2 absorption deviations (filled: H < 10) | |||||||||||||||||||||||
| 0 | 0 |
|
|
|
|
|
|
| IPAIR | NAME | SHIFT | NEWSHIFT | S/N | NAME | SHIFT | NEWSHIFT | S/N |
| 0 | 11450060 | 0.476732 | 0.00000 | 19.0782 | 11450059 | -0.00211526 | 0.478847 | 19.0876 |
| 1 | 11450061 | 0.476673 | 5.89788e-05 | 19.0737 | 11450058 | -0.00159235 | 0.478324 | 19.0686 |
| 2 | 11450057 | 0.475823 | 0.000909001 | 19.0249 | 11450062 | -0.00142255 | 0.478155 | 19.0612 |
| 3 | 11450056 | 0.475453 | 0.00127900 | 18.9104 | 11450055 | 0.00000 | 0.476732 | 19.0157 |