| Red | Green | Blue | |
| z | 17.64 | ||
| znorm | Inf | ||
| sky | -Inf | -Inf | -NaN |
| S/N | 22.1 | 39.0 | 41.8 |
| S/N(c) | 0.0 | 0.0 | 0.0 |
| SN(E/C) |

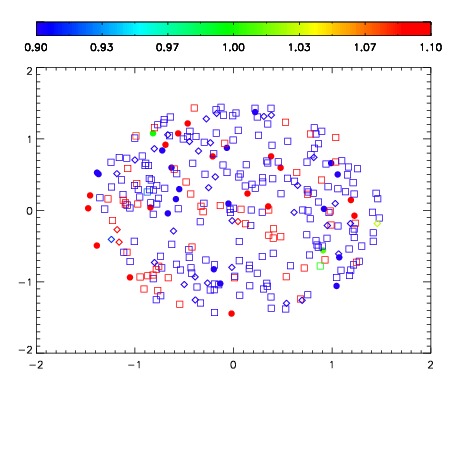
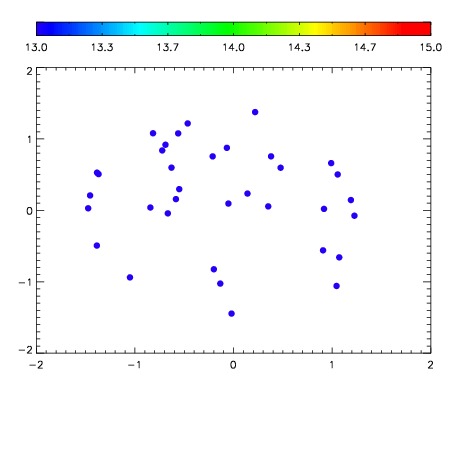

| Frame | Nreads | Zeropoints | Mag plots | Spatial mag deviation | Spatial sky 16325A emission deviations (filled: sky, open: star) | Spatial sky continuum emission | Spatial sky telluric CO2 absorption deviations (filled: H < 10) | |||||||||||||||||||||||
| 0 | 0 |
|
|
|
|
|
|
| IPAIR | NAME | SHIFT | NEWSHIFT | S/N | NAME | SHIFT | NEWSHIFT | S/N |
| 0 | 08180029 | 0.509704 | 0.00000 | 18.2339 | 08180030 | -0.00142062 | 0.511125 | 16.6977 |
| 1 | 08180028 | 0.502461 | 0.00724298 | 18.9569 | 08180027 | -0.00372283 | 0.513427 | 19.1045 |
| 2 | 08180024 | 0.503244 | 0.00646001 | 18.9403 | 08180026 | -0.00202878 | 0.511733 | 18.9910 |
| 3 | 08180025 | 0.509589 | 0.000114977 | 18.5195 | 08180023 | 0.00000 | 0.509704 | 18.6210 |