| Red | Green | Blue | |
| z | 17.64 | ||
| znorm | Inf | ||
| sky | -NaN | -Inf | -Inf |
| S/N | 21.1 | 38.7 | 42.1 |
| S/N(c) | 0.0 | 0.0 | 0.0 |
| SN(E/C) |
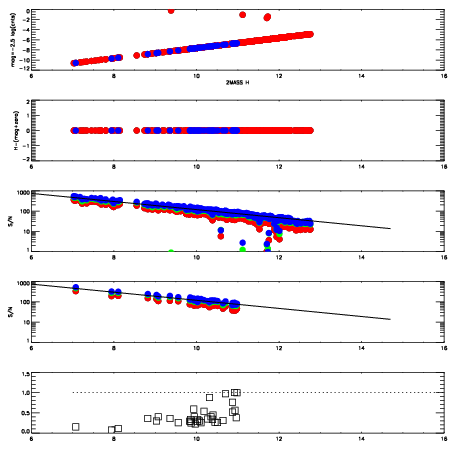


| Frame | Nreads | Zeropoints | Mag plots | Spatial mag deviation | Spatial sky 16325A emission deviations (filled: sky, open: star) | Spatial sky continuum emission | Spatial sky telluric CO2 absorption deviations (filled: H < 10) | |||||||||||||||||||||||
| 0 | 0 |
|
|
|
|
|
|
| IPAIR | NAME | SHIFT | NEWSHIFT | S/N | NAME | SHIFT | NEWSHIFT | S/N |
| 0 | 08430054 | 0.487321 | 0.00000 | 18.4919 | 08430055 | -0.000373197 | 0.487694 | 18.3988 |
| 1 | 08430050 | 0.486205 | 0.00111598 | 18.8434 | 08430052 | -0.000803424 | 0.488124 | 18.8686 |
| 2 | 08430049 | 0.486232 | 0.00108898 | 18.7098 | 08430048 | 0.00000 | 0.487321 | 18.8127 |
| 3 | 08430053 | 0.486067 | 0.00125399 | 18.6572 | 08430051 | 0.00437499 | 0.482946 | 18.5956 |