| Red | Green | Blue | |
| z | 17.64 | ||
| znorm | Inf | ||
| sky | -Inf | -Inf | -Inf |
| S/N | 25.4 | 44.6 | 48.9 |
| S/N(c) | 0.0 | 0.0 | 0.0 |
| SN(E/C) |
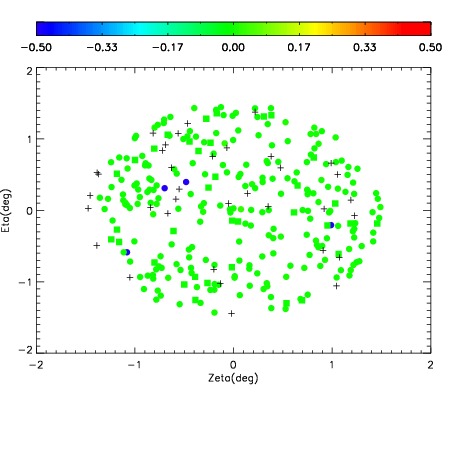
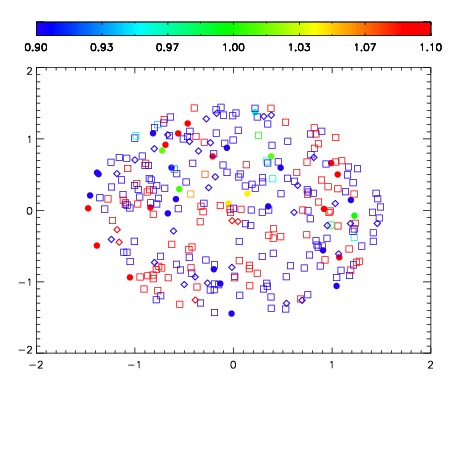
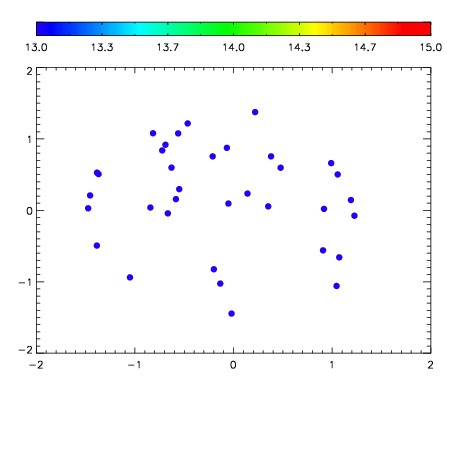

| Frame | Nreads | Zeropoints | Mag plots | Spatial mag deviation | Spatial sky 16325A emission deviations (filled: sky, open: star) | Spatial sky continuum emission | Spatial sky telluric CO2 absorption deviations (filled: H < 10) | |||||||||||||||||||||||
| 0 | 0 |
|
|
|
|
|
|
| IPAIR | NAME | SHIFT | NEWSHIFT | S/N | NAME | SHIFT | NEWSHIFT | S/N |
| 0 | 08500031 | 0.490231 | 0.00000 | 18.9352 | 08500033 | 0.000621358 | 0.489610 | 18.9316 |
| 1 | 08500034 | 0.486136 | 0.00409502 | 18.9993 | 08500029 | 0.00000 | 0.490231 | 18.9920 |
| 2 | 08500030 | 0.489435 | 0.000796020 | 18.9800 | 08500032 | 0.00131881 | 0.488912 | 18.9717 |
| 3 | 08500035 | 0.486595 | 0.00363600 | 18.9650 | 08500036 | 0.00266660 | 0.487564 | 18.9651 |