| Red | Green | Blue | |
| z | 17.64 | ||
| znorm | Inf | ||
| sky | -NaN | -Inf | -Inf |
| S/N | 26.7 | 46.4 | 48.7 |
| S/N(c) | 0.0 | 0.0 | 0.0 |
| SN(E/C) |

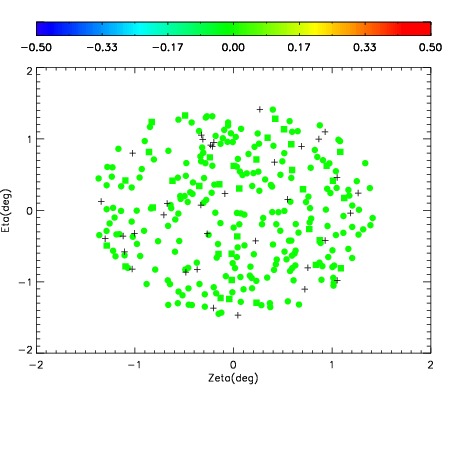
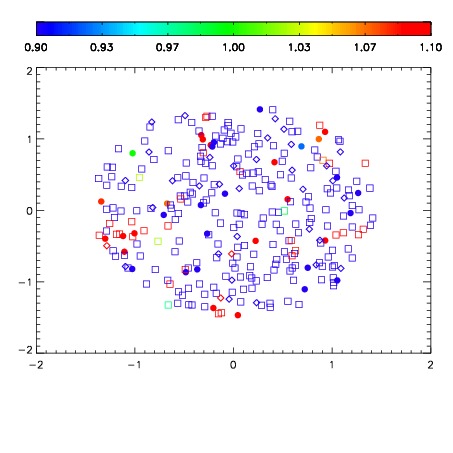


| Frame | Nreads | Zeropoints | Mag plots | Spatial mag deviation | Spatial sky 16325A emission deviations (filled: sky, open: star) | Spatial sky continuum emission | Spatial sky telluric CO2 absorption deviations (filled: H < 10) | |||||||||||||||||||||||
| 0 | 0 |
|
|
|
|
|
|
| IPAIR | NAME | SHIFT | NEWSHIFT | S/N | NAME | SHIFT | NEWSHIFT | S/N |
| 0 | 08440053 | 0.482308 | 0.00000 | 19.0511 | 08440051 | 0.00127566 | 0.481032 | 19.0144 |
| 1 | 08440052 | 0.481103 | 0.00120500 | 19.0317 | 08440050 | 0.00474737 | 0.477561 | 19.0142 |
| 2 | 08440048 | 0.482083 | 0.000225008 | 19.0272 | 08440047 | 0.00000 | 0.482308 | 19.0068 |
| 3 | 08440049 | 0.481926 | 0.000382006 | 19.0147 | 08440054 | 0.00468483 | 0.477623 | 18.9558 |