| Red | Green | Blue | |
| z | 17.64 | ||
| znorm | Inf | ||
| sky | -Inf | -NaN | -Inf |
| S/N | 25.6 | 44.6 | 47.8 |
| S/N(c) | 0.0 | 0.0 | 0.0 |
| SN(E/C) |

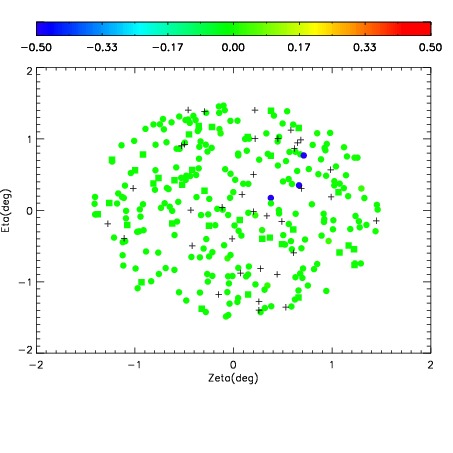


| Frame | Nreads | Zeropoints | Mag plots | Spatial mag deviation | Spatial sky 16325A emission deviations (filled: sky, open: star) | Spatial sky continuum emission | Spatial sky telluric CO2 absorption deviations (filled: H < 10) | |||||||||||||||||||||||
| 0 | 0 |
|
|
|
|
|
|
| IPAIR | NAME | SHIFT | NEWSHIFT | S/N | NAME | SHIFT | NEWSHIFT | S/N |
| 0 | 08180036 | 0.510216 | 0.00000 | 18.8167 | 08180034 | 0.00000 | 0.510216 | 17.5269 |
| 1 | 08180039 | 0.505546 | 0.00467002 | 19.1655 | 08180038 | -0.00322993 | 0.513446 | 19.1923 |
| 2 | 08180040 | 0.510148 | 6.80089e-05 | 19.1080 | 08180041 | -0.00133964 | 0.511556 | 19.1311 |
| 3 | 08180035 | 0.505271 | 0.00494498 | 19.0787 | 08180037 | -0.00163926 | 0.511855 | 19.0621 |