| Red | Green | Blue | |
| z | 17.64 | ||
| znorm | Inf | ||
| sky | -Inf | -Inf | -Inf |
| S/N | 22.5 | 37.8 | 41.6 |
| S/N(c) | 0.0 | 0.0 | 0.0 |
| SN(E/C) |
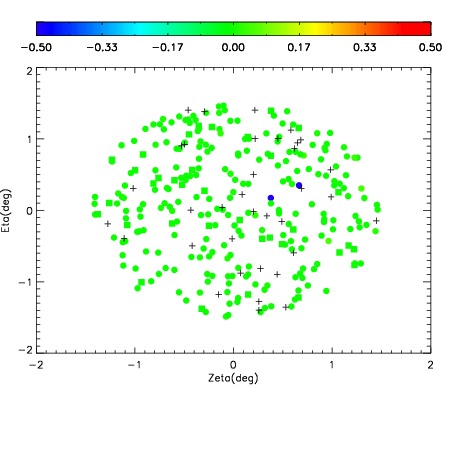
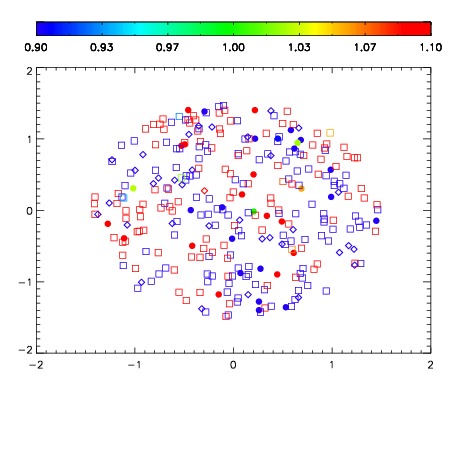


| Frame | Nreads | Zeropoints | Mag plots | Spatial mag deviation | Spatial sky 16325A emission deviations (filled: sky, open: star) | Spatial sky continuum emission | Spatial sky telluric CO2 absorption deviations (filled: H < 10) | |||||||||||||||||||||||
| 0 | 0 |
|
|
|
|
|
|
| IPAIR | NAME | SHIFT | NEWSHIFT | S/N | NAME | SHIFT | NEWSHIFT | S/N |
| 0 | 08430039 | 0.490375 | 0.00000 | 18.9215 | 08430044 | 0.00258401 | 0.487791 | 18.9017 |
| 1 | 08430038 | 0.490301 | 7.39992e-05 | 19.0326 | 08430037 | 0.00000 | 0.490375 | 18.9860 |
| 2 | 08430043 | 0.487346 | 0.00302902 | 18.8925 | 08430041 | 0.00250000 | 0.487875 | 18.5636 |
| 3 | 08430042 | 0.487015 | 0.00336000 | 18.7730 | 08430040 | 0.00410401 | 0.486271 | 18.5622 |