| Red | Green | Blue | |
| z | 17.64 | ||
| znorm | Inf | ||
| sky | -Inf | -Inf | -Inf |
| S/N | 24.3 | 42.3 | 45.9 |
| S/N(c) | 0.0 | 0.0 | 0.0 |
| SN(E/C) |

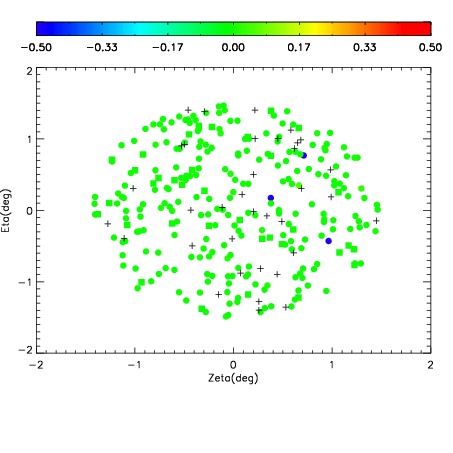
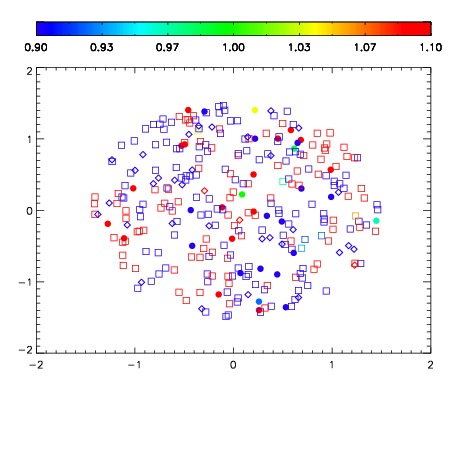
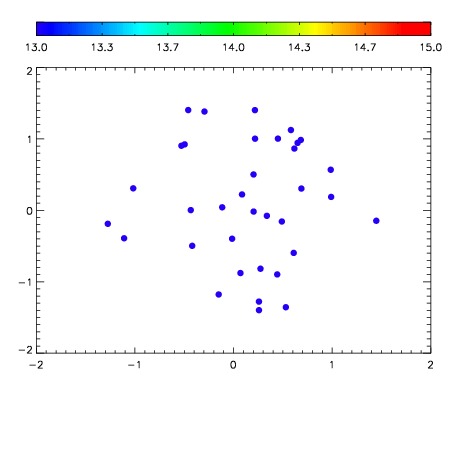

| Frame | Nreads | Zeropoints | Mag plots | Spatial mag deviation | Spatial sky 16325A emission deviations (filled: sky, open: star) | Spatial sky continuum emission | Spatial sky telluric CO2 absorption deviations (filled: H < 10) | |||||||||||||||||||||||
| 0 | 0 |
|
|
|
|
|
|
| IPAIR | NAME | SHIFT | NEWSHIFT | S/N | NAME | SHIFT | NEWSHIFT | S/N |
| 0 | 08500045 | 0.487643 | 0.00000 | 18.9747 | 08500048 | -0.000219205 | 0.487862 | 18.9469 |
| 1 | 08500050 | 0.486184 | 0.00145900 | 18.9434 | 08500044 | 0.00000 | 0.487643 | 18.9341 |
| 2 | 08500046 | 0.487547 | 9.59933e-05 | 18.9426 | 08500051 | 0.00196640 | 0.485677 | 18.9130 |
| 3 | 08500049 | 0.486301 | 0.00134200 | 18.9147 | 08500047 | 0.00112181 | 0.486521 | 18.8750 |