| Red | Green | Blue | |
| z | 17.64 | ||
| znorm | Inf | ||
| sky | -Inf | -Inf | -Inf |
| S/N | 18.5 | 33.2 | 36.4 |
| S/N(c) | 0.0 | 0.0 | 0.0 |
| SN(E/C) |
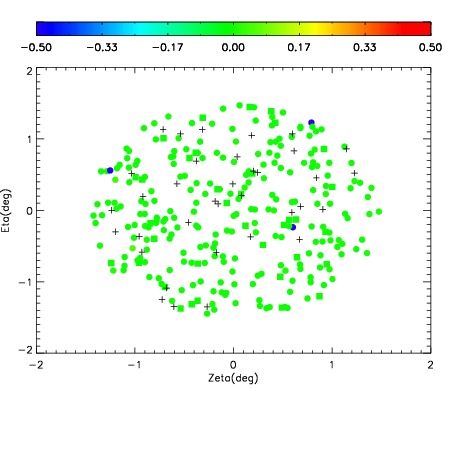
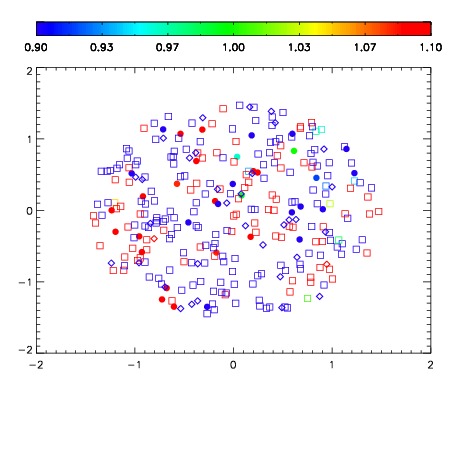


| Frame | Nreads | Zeropoints | Mag plots | Spatial mag deviation | Spatial sky 16325A emission deviations (filled: sky, open: star) | Spatial sky continuum emission | Spatial sky telluric CO2 absorption deviations (filled: H < 10) | |||||||||||||||||||||||
| 0 | 0 |
|
|
|
|
|
|
| IPAIR | NAME | SHIFT | NEWSHIFT | S/N | NAME | SHIFT | NEWSHIFT | S/N |
| 0 | 08430061 | 0.492944 | 0.00000 | 18.7782 | 08430066 | 0.00557159 | 0.487372 | 18.8057 |
| 1 | 08430065 | 0.488929 | 0.00401500 | 18.7207 | 08430059 | 0.00000 | 0.492944 | 18.7592 |
| 2 | 08430060 | 0.492936 | 8.01682e-06 | 18.5774 | 08430063 | 0.00476926 | 0.488175 | 18.5683 |
| 3 | 08430064 | 0.489046 | 0.00389799 | 18.3902 | 08430062 | 0.00419479 | 0.488749 | 18.2539 |