| Red | Green | Blue | |
| z | 17.64 | ||
| znorm | Inf | ||
| sky | -Inf | -NaN | -Inf |
| S/N | 17.1 | 31.0 | 33.2 |
| S/N(c) | 0.0 | 0.0 | 0.0 |
| SN(E/C) |
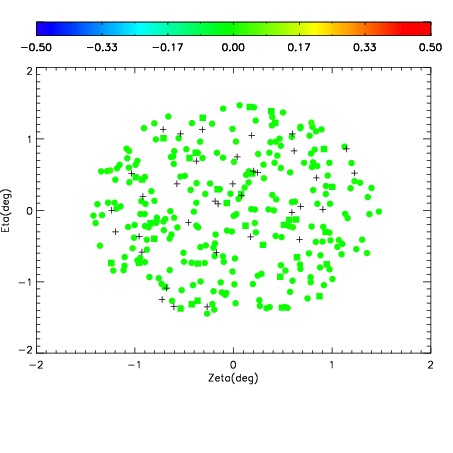
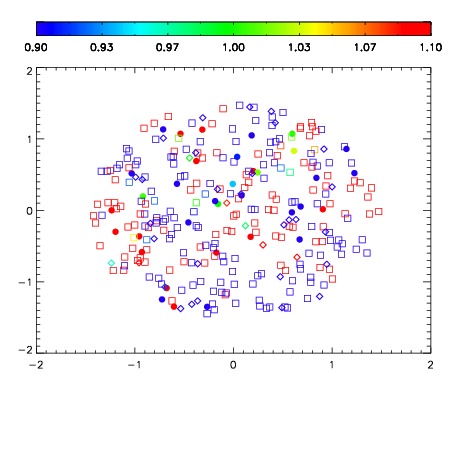
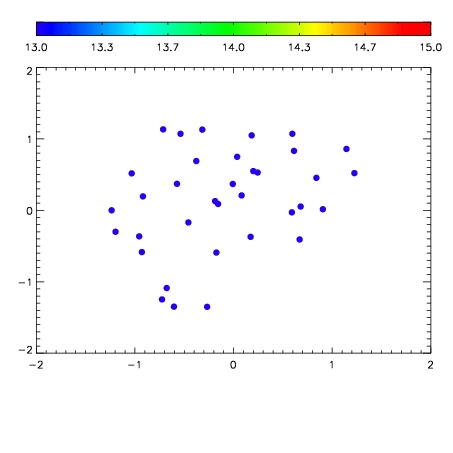

| Frame | Nreads | Zeropoints | Mag plots | Spatial mag deviation | Spatial sky 16325A emission deviations (filled: sky, open: star) | Spatial sky continuum emission | Spatial sky telluric CO2 absorption deviations (filled: H < 10) | |||||||||||||||||||||||
| 0 | 0 |
|
|
|
|
|
|
| IPAIR | NAME | SHIFT | NEWSHIFT | S/N | NAME | SHIFT | NEWSHIFT | S/N |
| 0 | 08470073 | 0.489813 | 0.00000 | 18.4887 | 08470074 | 0.00450834 | 0.485305 | 18.6394 |
| 1 | 08470072 | 0.488804 | 0.00100899 | 18.4844 | 08470078 | 0.00361799 | 0.486195 | 18.5463 |
| 2 | 08470077 | 0.489551 | 0.000261992 | 18.3246 | 08470071 | 0.00000 | 0.489813 | 18.4906 |
| 3 | 08470076 | 0.488304 | 0.00150901 | 18.3043 | 08470075 | 0.00249620 | 0.487317 | 18.4445 |