| Red | Green | Blue | |
| z | 17.64 | ||
| znorm | Inf | ||
| sky | -Inf | -Inf | -Inf |
| S/N | 26.1 | 44.9 | 48.6 |
| S/N(c) | 0.0 | 0.0 | 0.0 |
| SN(E/C) |
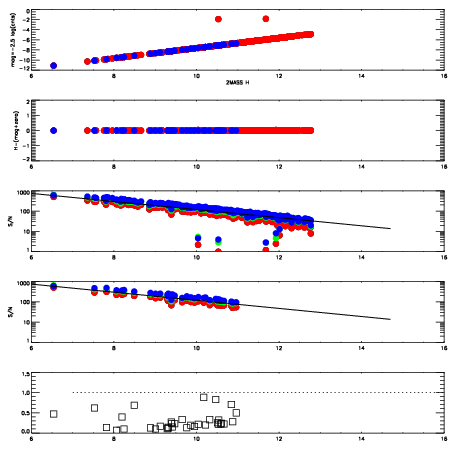
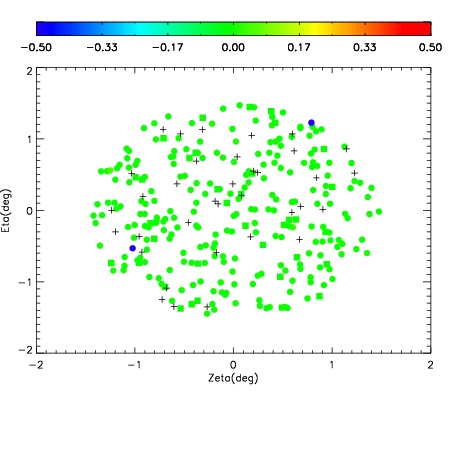
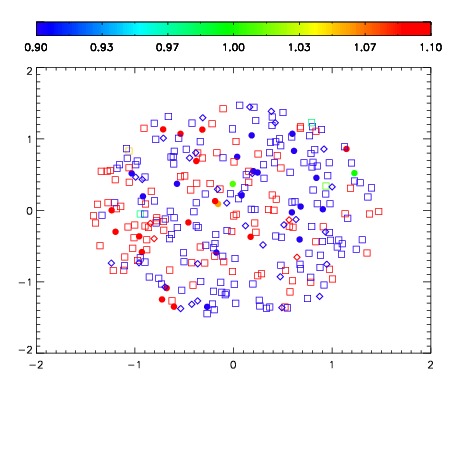
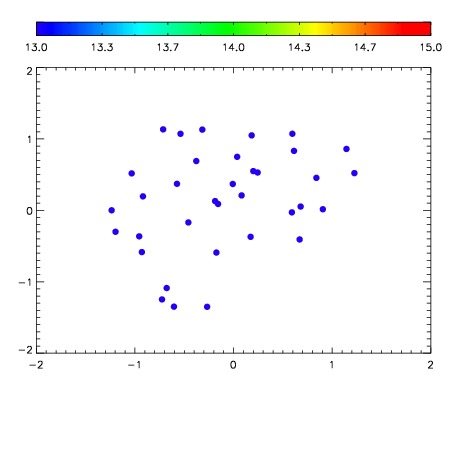

| Frame | Nreads | Zeropoints | Mag plots | Spatial mag deviation | Spatial sky 16325A emission deviations (filled: sky, open: star) | Spatial sky continuum emission | Spatial sky telluric CO2 absorption deviations (filled: H < 10) | |||||||||||||||||||||||
| 0 | 0 |
|
|
|
|
|
|
| IPAIR | NAME | SHIFT | NEWSHIFT | S/N | NAME | SHIFT | NEWSHIFT | S/N |
| 0 | 08490028 | 0.485552 | 0.00000 | 19.0691 | 08490026 | 0.00000 | 0.485552 | 19.0792 |
| 1 | 08490032 | 0.484384 | 0.00116801 | 19.0600 | 08490029 | 0.00341879 | 0.482133 | 19.0427 |
| 2 | 08490027 | 0.485230 | 0.000322014 | 19.0378 | 08490033 | 0.00400414 | 0.481548 | 19.0411 |
| 3 | 08490031 | 0.483946 | 0.00160602 | 19.0273 | 08490030 | 0.00297885 | 0.482573 | 19.0325 |