| Red | Green | Blue | |
| z | 17.64 | ||
| znorm | Inf | ||
| sky | -NaN | -NaN | -Inf |
| S/N | 23.8 | 41.5 | 45.9 |
| S/N(c) | 0.0 | 0.0 | 0.0 |
| SN(E/C) |
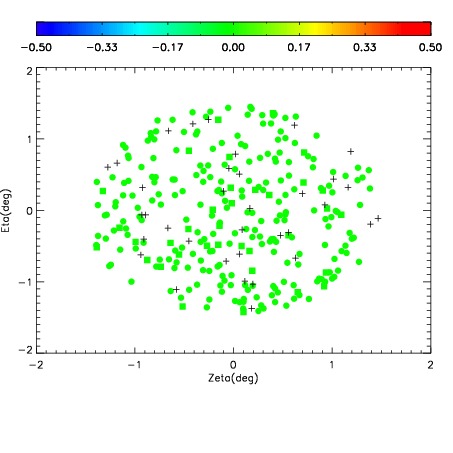

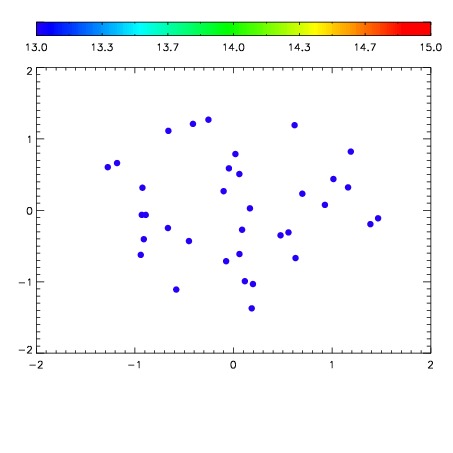

| Frame | Nreads | Zeropoints | Mag plots | Spatial mag deviation | Spatial sky 16325A emission deviations (filled: sky, open: star) | Spatial sky continuum emission | Spatial sky telluric CO2 absorption deviations (filled: H < 10) | |||||||||||||||||||||||
| 0 | 0 |
|
|
|
|
|
|
| IPAIR | NAME | SHIFT | NEWSHIFT | S/N | NAME | SHIFT | NEWSHIFT | S/N |
| 0 | 08420060 | 0.486908 | 0.00000 | 18.9768 | 08420059 | 0.00000 | 0.486908 | 18.9954 |
| 1 | 08420064 | 0.485456 | 0.00145200 | 19.0543 | 08420066 | 0.00108423 | 0.485824 | 19.0320 |
| 2 | 08420065 | 0.485307 | 0.00160098 | 19.0315 | 08420063 | 0.00309172 | 0.483816 | 19.0021 |
| 3 | 08420061 | 0.486049 | 0.000858992 | 18.9470 | 08420062 | 0.00497507 | 0.481933 | 18.9419 |