| Red | Green | Blue | |
| z | 17.64 | ||
| znorm | Inf | ||
| sky | -NaN | -NaN | -Inf |
| S/N | 23.2 | 42.4 | 45.5 |
| S/N(c) | 0.0 | 0.0 | 0.0 |
| SN(E/C) |
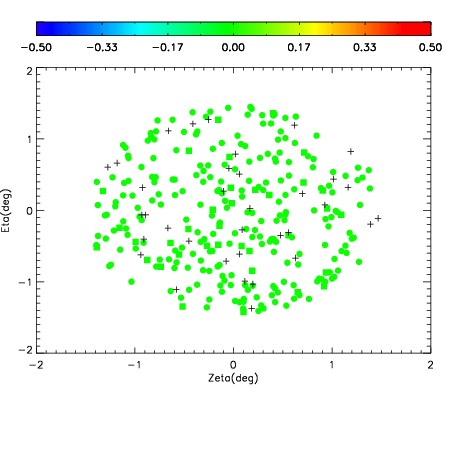
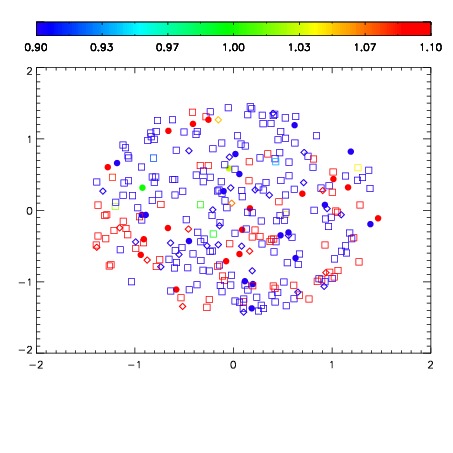


| Frame | Nreads | Zeropoints | Mag plots | Spatial mag deviation | Spatial sky 16325A emission deviations (filled: sky, open: star) | Spatial sky continuum emission | Spatial sky telluric CO2 absorption deviations (filled: H < 10) | |||||||||||||||||||||||
| 0 | 0 |
|
|
|
|
|
|
| IPAIR | NAME | SHIFT | NEWSHIFT | S/N | NAME | SHIFT | NEWSHIFT | S/N |
| 0 | 08480059 | 0.485088 | 0.00000 | 18.9451 | 08480060 | 0.00164510 | 0.483443 | 18.9942 |
| 1 | 08480062 | 0.482594 | 0.00249398 | 18.9353 | 08480061 | 0.000498456 | 0.484590 | 18.9733 |
| 2 | 08480063 | 0.483319 | 0.00176898 | 18.9110 | 08480064 | 0.000905713 | 0.484182 | 18.9343 |
| 3 | 08480058 | 0.484647 | 0.000440985 | 18.8961 | 08480057 | 0.00000 | 0.485088 | 18.8228 |