| Red | Green | Blue | |
| z | 17.64 | ||
| znorm | Inf | ||
| sky | -NaN | -NaN | -Inf |
| S/N | 21.7 | 39.6 | 42.8 |
| S/N(c) | 0.0 | 0.0 | 0.0 |
| SN(E/C) |


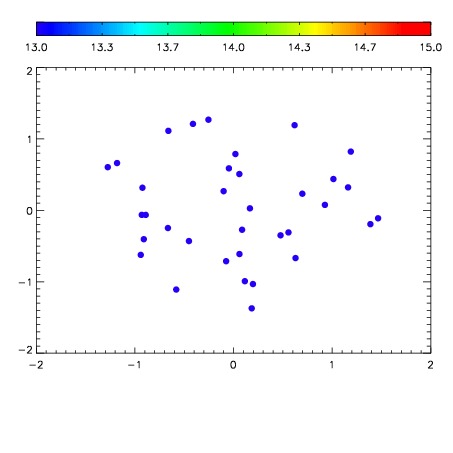

| Frame | Nreads | Zeropoints | Mag plots | Spatial mag deviation | Spatial sky 16325A emission deviations (filled: sky, open: star) | Spatial sky continuum emission | Spatial sky telluric CO2 absorption deviations (filled: H < 10) | |||||||||||||||||||||||
| 0 | 0 |
|
|
|
|
|
|
| IPAIR | NAME | SHIFT | NEWSHIFT | S/N | NAME | SHIFT | NEWSHIFT | S/N |
| 0 | 11470061 | 0.479280 | 0.00000 | 18.9042 | 11470058 | -0.000952756 | 0.480233 | 18.9673 |
| 1 | 11470060 | 0.478506 | 0.000773996 | 19.0217 | 11470059 | -0.00130716 | 0.480587 | 19.0546 |
| 2 | 11470056 | 0.477414 | 0.00186598 | 18.8943 | 11470055 | 0.00000 | 0.479280 | 18.8078 |
| 3 | 11470057 | 0.477271 | 0.00200900 | 18.8744 | 11470062 | -0.000570561 | 0.479851 | 18.3217 |