| Red | Green | Blue | |
| z | 17.64 | ||
| znorm | Inf | ||
| sky | -Inf | -Inf | -Inf |
| S/N | 26.9 | 47.8 | 51.2 |
| S/N(c) | 0.0 | 0.0 | 0.0 |
| SN(E/C) |
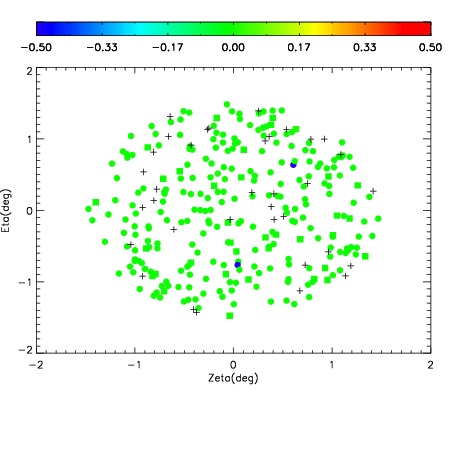
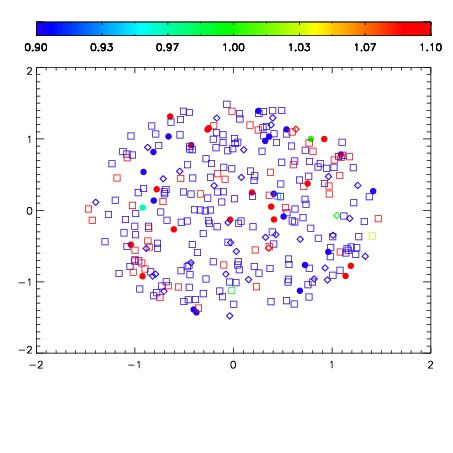
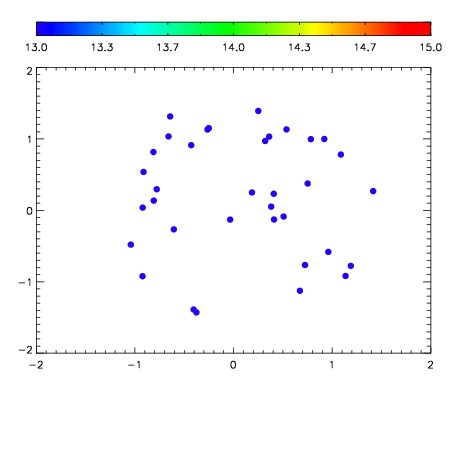

| Frame | Nreads | Zeropoints | Mag plots | Spatial mag deviation | Spatial sky 16325A emission deviations (filled: sky, open: star) | Spatial sky continuum emission | Spatial sky telluric CO2 absorption deviations (filled: H < 10) | |||||||||||||||||||||||
| 0 | 0 |
|
|
|
|
|
|
| IPAIR | NAME | SHIFT | NEWSHIFT | S/N | NAME | SHIFT | NEWSHIFT | S/N |
| 0 | 08160038 | 0.510943 | 0.00000 | 19.0912 | 08160040 | -0.00343191 | 0.514375 | 19.1131 |
| 1 | 08160041 | 0.500355 | 0.0105880 | 19.1002 | 08160039 | -0.00294007 | 0.513883 | 19.1227 |
| 2 | 08160042 | 0.508596 | 0.00234699 | 19.0838 | 08160043 | -0.00225388 | 0.513197 | 19.0816 |
| 3 | 08160037 | 0.503658 | 0.00728500 | 19.0799 | 08160036 | 0.00000 | 0.510943 | 19.0382 |