| Red | Green | Blue | |
| z | 17.64 | ||
| znorm | Inf | ||
| sky | -Inf | -Inf | -Inf |
| S/N | 25.8 | 45.6 | 49.9 |
| S/N(c) | 0.0 | 0.0 | 0.0 |
| SN(E/C) |
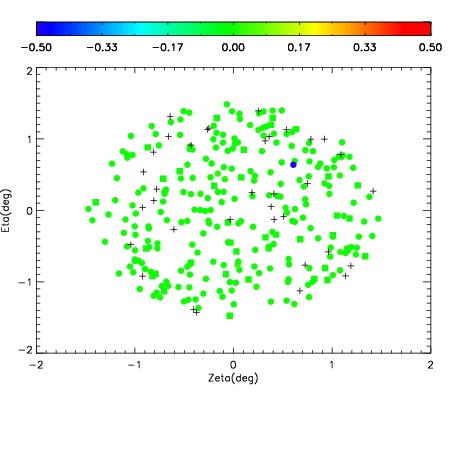

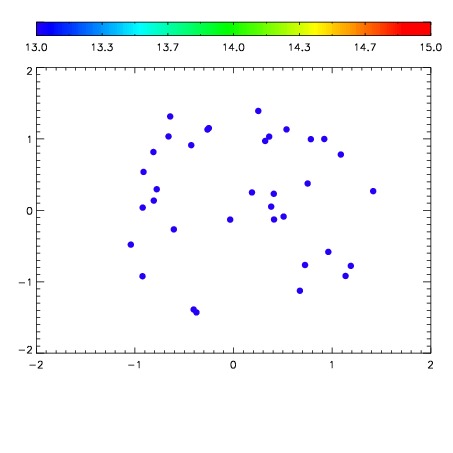

| Frame | Nreads | Zeropoints | Mag plots | Spatial mag deviation | Spatial sky 16325A emission deviations (filled: sky, open: star) | Spatial sky continuum emission | Spatial sky telluric CO2 absorption deviations (filled: H < 10) | |||||||||||||||||||||||
| 0 | 0 |
|
|
|
|
|
|
| IPAIR | NAME | SHIFT | NEWSHIFT | S/N | NAME | SHIFT | NEWSHIFT | S/N |
| 0 | 08420054 | 0.486512 | 0.00000 | 19.1049 | 08420055 | -0.00178181 | 0.488294 | 19.1095 |
| 1 | 08420050 | 0.485109 | 0.00140300 | 19.0416 | 08420052 | -0.00240756 | 0.488920 | 19.0418 |
| 2 | 08420053 | 0.486117 | 0.000395000 | 19.0085 | 08420051 | 0.000295228 | 0.486217 | 19.0282 |
| 3 | 08420049 | 0.485798 | 0.000714004 | 18.8773 | 08420048 | 0.00000 | 0.486512 | 18.8944 |