| Red | Green | Blue | |
| z | 17.64 | ||
| znorm | Inf | ||
| sky | -Inf | -Inf | -Inf |
| S/N | 16.7 | 31.0 | 32.6 |
| S/N(c) | 0.0 | 0.0 | 0.0 |
| SN(E/C) |

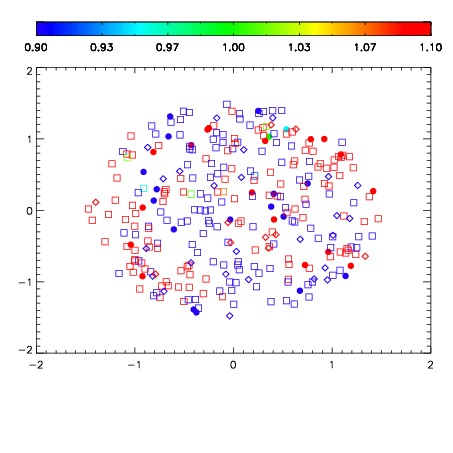


| Frame | Nreads | Zeropoints | Mag plots | Spatial mag deviation | Spatial sky 16325A emission deviations (filled: sky, open: star) | Spatial sky continuum emission | Spatial sky telluric CO2 absorption deviations (filled: H < 10) | |||||||||||||||||||||||
| 0 | 0 |
|
|
|
|
|
|
| IPAIR | NAME | SHIFT | NEWSHIFT | S/N | NAME | SHIFT | NEWSHIFT | S/N |
| 0 | 08470084 | 0.489835 | 0.00000 | 18.4172 | 08470082 | 0.00000 | 0.489835 | 18.4024 |
| 1 | 08470085 | 0.00308701 | 0.486748 | 18.5434 | 08470087 | -0.431002 | 0.920837 | 18.5517 |
| 2 | 08470088 | -0.427605 | 0.917440 | 18.4813 | 08470086 | -0.887796 | 1.37763 | 18.4578 |
| 3 | 08470083 | 0.487635 | 0.00220001 | 18.4179 | 08470089 | -0.118959 | 0.608794 | 18.4246 |