| Red | Green | Blue | |
| z | 17.64 | ||
| znorm | Inf | ||
| sky | -Inf | -NaN | -Inf |
| S/N | 25.6 | 43.8 | 48.0 |
| S/N(c) | 0.0 | 0.0 | 0.0 |
| SN(E/C) |
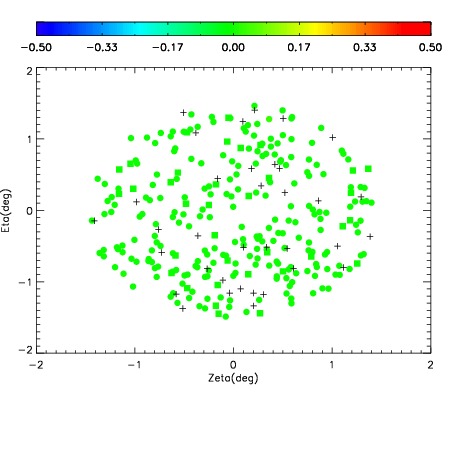
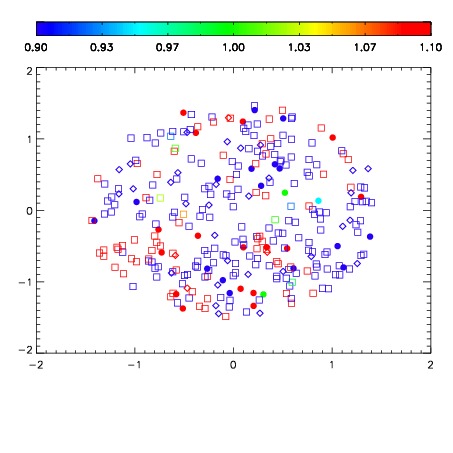


| Frame | Nreads | Zeropoints | Mag plots | Spatial mag deviation | Spatial sky 16325A emission deviations (filled: sky, open: star) | Spatial sky continuum emission | Spatial sky telluric CO2 absorption deviations (filled: H < 10) | |||||||||||||||||||||||
| 0 | 0 |
|
|
|
|
|
|
| IPAIR | NAME | SHIFT | NEWSHIFT | S/N | NAME | SHIFT | NEWSHIFT | S/N |
| 0 | 08730046 | 0.482897 | 0.00000 | 19.0844 | 08730047 | 0.00239254 | 0.480504 | 19.0880 |
| 1 | 08730049 | 0.480022 | 0.00287500 | 19.0632 | 08730051 | 0.00410721 | 0.478790 | 19.0698 |
| 2 | 08730050 | 0.480404 | 0.00249302 | 19.0461 | 08730048 | 0.00252277 | 0.480374 | 19.0648 |
| 3 | 08730045 | 0.482410 | 0.000487000 | 19.0332 | 08730044 | 0.00000 | 0.482897 | 18.9589 |