| Red | Green | Blue | |
| z | 17.64 | ||
| znorm | Inf | ||
| sky | -NaN | -Inf | -Inf |
| S/N | 27.4 | 47.5 | 50.9 |
| S/N(c) | 0.0 | 0.0 | 0.0 |
| SN(E/C) |

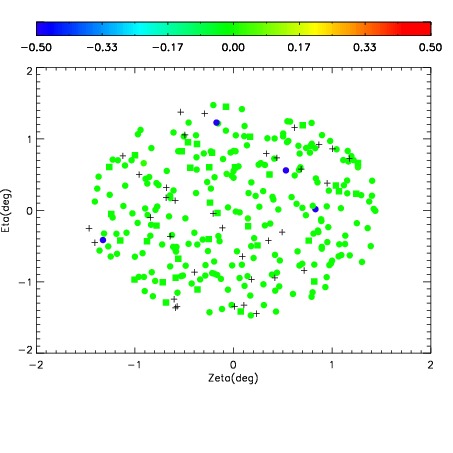

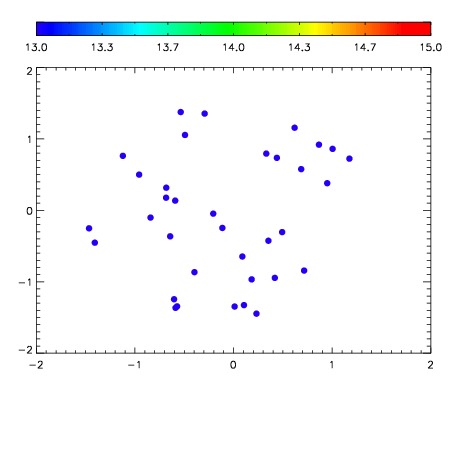

| Frame | Nreads | Zeropoints | Mag plots | Spatial mag deviation | Spatial sky 16325A emission deviations (filled: sky, open: star) | Spatial sky continuum emission | Spatial sky telluric CO2 absorption deviations (filled: H < 10) | |||||||||||||||||||||||
| 0 | 0 |
|
|
|
|
|
|
| IPAIR | NAME | SHIFT | NEWSHIFT | S/N | NAME | SHIFT | NEWSHIFT | S/N |
| 0 | 08150054 | 0.512620 | 0.00000 | 19.0967 | 08150055 | -0.00591241 | 0.518532 | 19.1076 |
| 1 | 08150053 | 0.495773 | 0.0168470 | 19.0725 | 08150051 | -0.00530628 | 0.517926 | 19.0944 |
| 2 | 08150050 | 0.511318 | 0.00130194 | 19.0386 | 08150052 | -0.00456959 | 0.517190 | 19.0666 |
| 3 | 08150049 | 0.498271 | 0.0143490 | 19.0228 | 08150048 | 0.00000 | 0.512620 | 19.0262 |