| Red | Green | Blue | |
| z | 17.64 | ||
| znorm | Inf | ||
| sky | -NaN | -NaN | -Inf |
| S/N | 27.8 | 47.3 | 50.8 |
| S/N(c) | 0.0 | 0.0 | 0.0 |
| SN(E/C) |
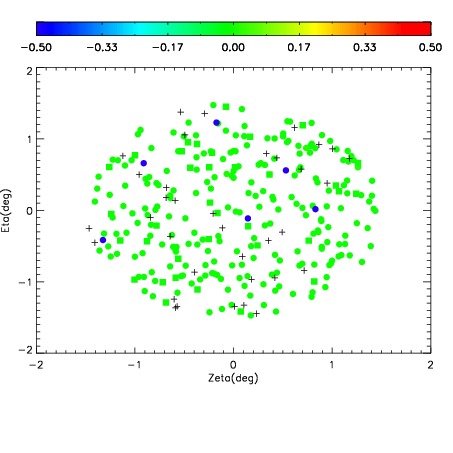
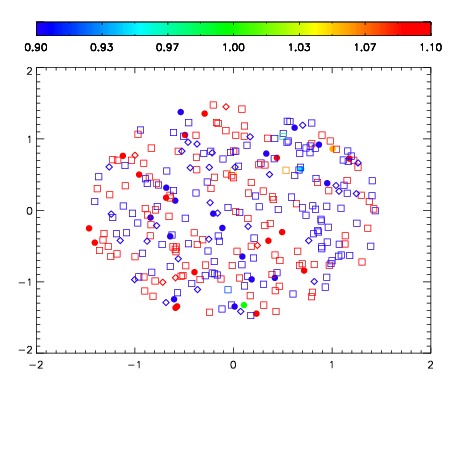
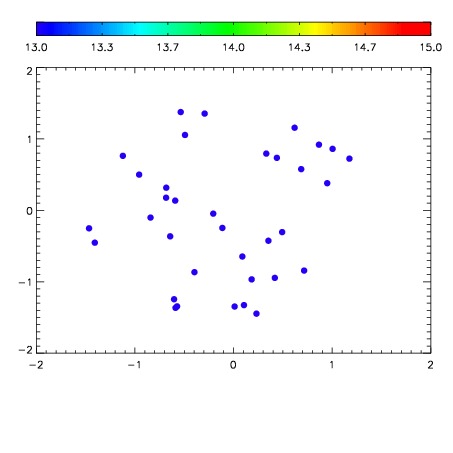

| Frame | Nreads | Zeropoints | Mag plots | Spatial mag deviation | Spatial sky 16325A emission deviations (filled: sky, open: star) | Spatial sky continuum emission | Spatial sky telluric CO2 absorption deviations (filled: H < 10) | |||||||||||||||||||||||
| 0 | 0 |
|
|
|
|
|
|
| IPAIR | NAME | SHIFT | NEWSHIFT | S/N | NAME | SHIFT | NEWSHIFT | S/N |
| 0 | 08410050 | 0.508216 | 0.00000 | 19.1122 | 08410052 | 0.000864888 | 0.507351 | 19.1248 |
| 1 | 08410054 | 0.505887 | 0.00232905 | 19.1214 | 08410051 | 0.00172253 | 0.506494 | 19.1463 |
| 2 | 08410053 | 0.505377 | 0.00283903 | 19.1120 | 08410055 | 0.00365591 | 0.504560 | 19.1025 |
| 3 | 08410049 | 0.507499 | 0.000717044 | 19.0808 | 08410048 | 0.00000 | 0.508216 | 19.0389 |