| Red | Green | Blue | |
| z | 17.64 | ||
| znorm | Inf | ||
| sky | -Inf | -Inf | -Inf |
| S/N | 24.6 | 40.9 | 45.4 |
| S/N(c) | 0.0 | 0.0 | 0.0 |
| SN(E/C) |

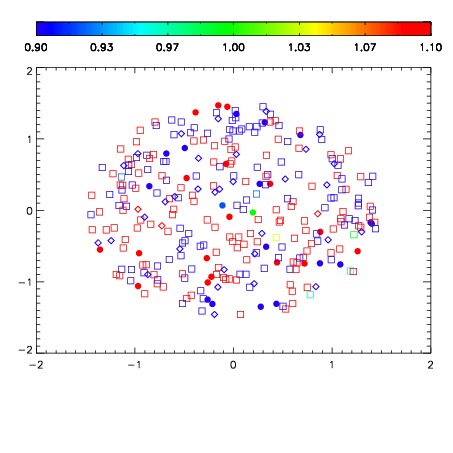
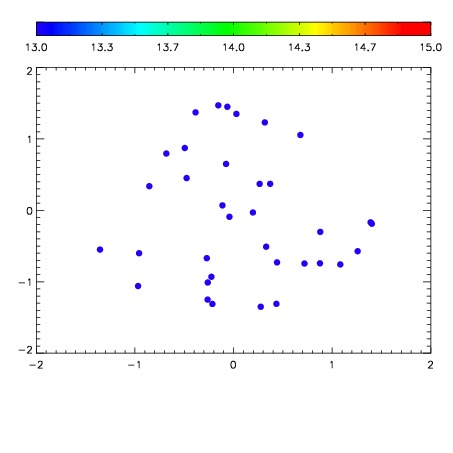

| Frame | Nreads | Zeropoints | Mag plots | Spatial mag deviation | Spatial sky 16325A emission deviations (filled: sky, open: star) | Spatial sky continuum emission | Spatial sky telluric CO2 absorption deviations (filled: H < 10) | |||||||||||||||||||||||
| 0 | 0 |
|
|
|
|
|
|
| IPAIR | NAME | SHIFT | NEWSHIFT | S/N | NAME | SHIFT | NEWSHIFT | S/N |
| 0 | 08140072 | 0.508928 | 0.00000 | 18.9134 | 08140070 | 0.00000 | 0.508928 | 18.9863 |
| 1 | 08140075 | 0.507345 | 0.00158298 | 18.9796 | 08140073 | -0.00132967 | 0.510258 | 19.0380 |
| 2 | 08140076 | 0.508426 | 0.000501990 | 18.9388 | 08140074 | -0.00262880 | 0.511557 | 18.9920 |
| 3 | 08140071 | 0.507340 | 0.00158799 | 18.8786 | 08140077 | 0.000590819 | 0.508337 | 18.8643 |