| Red | Green | Blue | |
| z | 17.64 | ||
| znorm | Inf | ||
| sky | -Inf | -Inf | -NaN |
| S/N | 24.2 | 43.1 | 44.3 |
| S/N(c) | 0.0 | 0.0 | 0.0 |
| SN(E/C) |
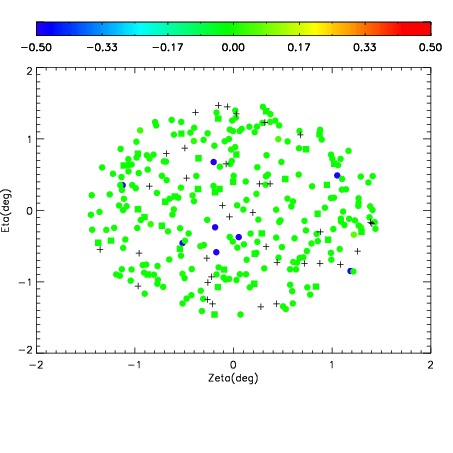
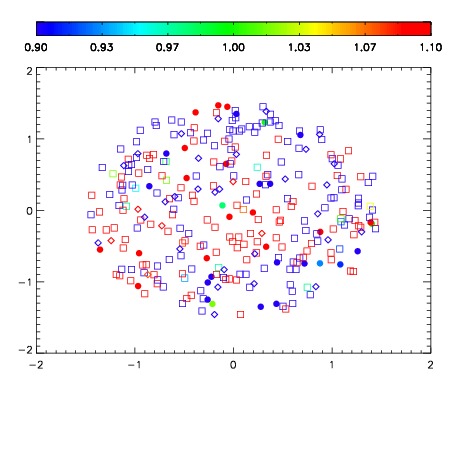
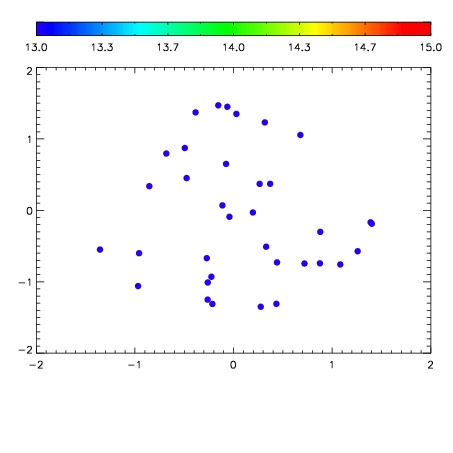

| Frame | Nreads | Zeropoints | Mag plots | Spatial mag deviation | Spatial sky 16325A emission deviations (filled: sky, open: star) | Spatial sky continuum emission | Spatial sky telluric CO2 absorption deviations (filled: H < 10) | |||||||||||||||||||||||
| 0 | 0 |
|
|
|
|
|
|
| IPAIR | NAME | SHIFT | NEWSHIFT | S/N | NAME | SHIFT | NEWSHIFT | S/N |
| 0 | 08210028 | 0.508417 | 0.00000 | 19.1053 | 08210022 | 0.00000 | 0.508417 | 19.0574 |
| 1 | 08210023 | 0.499944 | 0.00847301 | 19.0822 | 08210029 | -0.00724646 | 0.515663 | 19.0400 |
| 2 | 08210024 | 0.507152 | 0.00126499 | 19.0323 | 08210025 | -0.00631580 | 0.514733 | 18.9389 |
| 3 | 08210027 | 0.507765 | 0.000652015 | 18.9685 | 08210026 | -0.00725143 | 0.515668 | 18.6750 |