| Red | Green | Blue | |
| z | 17.64 | ||
| znorm | Inf | ||
| sky | -Inf | -Inf | -Inf |
| S/N | 26.6 | 44.5 | 47.6 |
| S/N(c) | 0.0 | 0.0 | 0.0 |
| SN(E/C) |
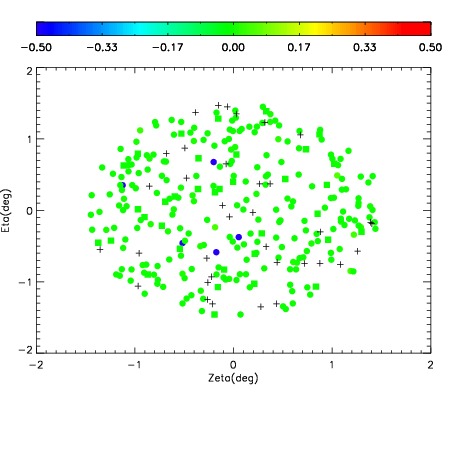
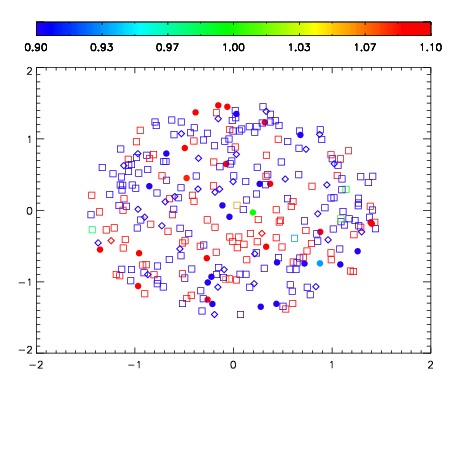


| Frame | Nreads | Zeropoints | Mag plots | Spatial mag deviation | Spatial sky 16325A emission deviations (filled: sky, open: star) | Spatial sky continuum emission | Spatial sky telluric CO2 absorption deviations (filled: H < 10) | |||||||||||||||||||||||
| 0 | 0 |
|
|
|
|
|
|
| IPAIR | NAME | SHIFT | NEWSHIFT | S/N | NAME | SHIFT | NEWSHIFT | S/N |
| 0 | 08400050 | 0.506358 | 0.00000 | 19.0583 | 08400052 | 0.00127281 | 0.505085 | 19.0421 |
| 1 | 08400053 | 0.505058 | 0.00130004 | 19.0568 | 08400051 | 0.00332323 | 0.503035 | 18.9978 |
| 2 | 08400049 | 0.505125 | 0.00123304 | 19.0272 | 08400048 | 0.00000 | 0.506358 | 18.9923 |
| 3 | 08400054 | 0.506127 | 0.000231028 | 19.0002 | 08400055 | 0.000928748 | 0.505429 | 18.9777 |