| Red | Green | Blue | |
| z | 17.64 | ||
| znorm | Inf | ||
| sky | -Inf | -Inf | -Inf |
| S/N | 23.0 | 41.5 | 46.1 |
| S/N(c) | 0.0 | 0.0 | 0.0 |
| SN(E/C) |
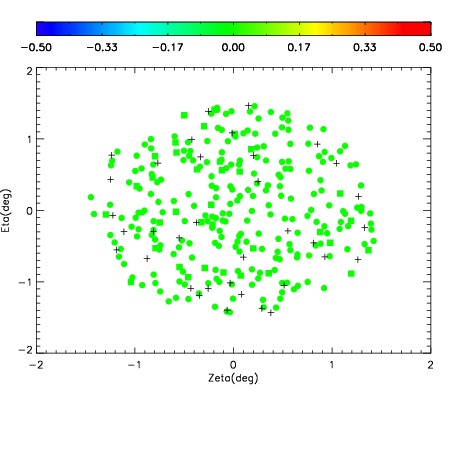
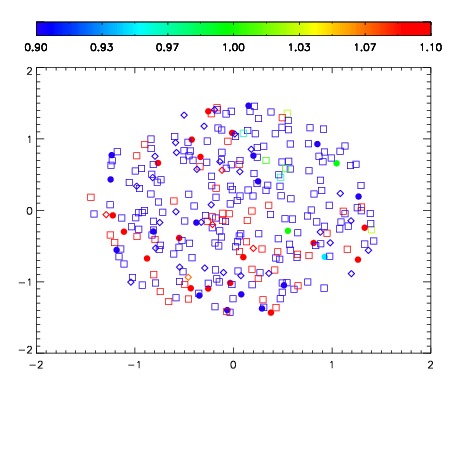
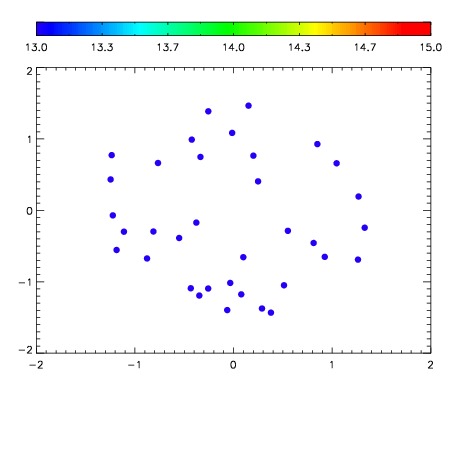

| Frame | Nreads | Zeropoints | Mag plots | Spatial mag deviation | Spatial sky 16325A emission deviations (filled: sky, open: star) | Spatial sky continuum emission | Spatial sky telluric CO2 absorption deviations (filled: H < 10) | |||||||||||||||||||||||
| 0 | 0 |
|
|
|
|
|
|
| IPAIR | NAME | SHIFT | NEWSHIFT | S/N | NAME | SHIFT | NEWSHIFT | S/N |
| 0 | 08160049 | 0.506419 | 0.00000 | 18.9286 | 08160050 | -0.00302121 | 0.509440 | 18.9002 |
| 1 | 08160053 | 0.503856 | 0.00256300 | 19.0545 | 08160054 | -0.00210435 | 0.508523 | 19.0216 |
| 2 | 08160048 | 0.500929 | 0.00549001 | 18.9176 | 08160047 | 0.00000 | 0.506419 | 18.8999 |
| 3 | 08160052 | 0.495402 | 0.0110170 | 18.8453 | 08160051 | -0.00510678 | 0.511526 | 18.8729 |