| Red | Green | Blue | |
| z | 17.64 | ||
| znorm | Inf | ||
| sky | -Inf | -Inf | -Inf |
| S/N | 11.0 | 20.7 | 22.1 |
| S/N(c) | 0.0 | 0.0 | 0.0 |
| SN(E/C) |
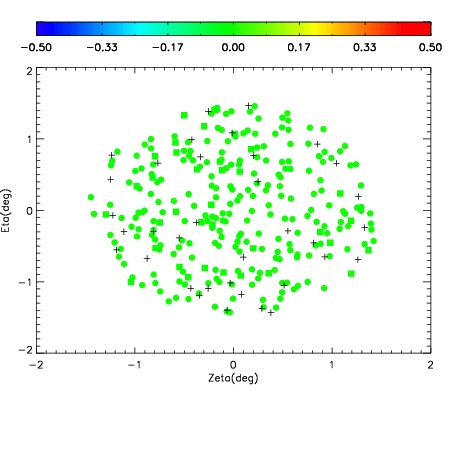

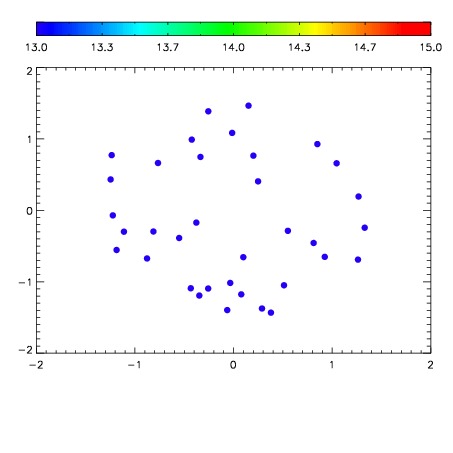

| Frame | Nreads | Zeropoints | Mag plots | Spatial mag deviation | Spatial sky 16325A emission deviations (filled: sky, open: star) | Spatial sky continuum emission | Spatial sky telluric CO2 absorption deviations (filled: H < 10) | |||||||||||||||||||||||
| 0 | 0 |
|
|
|
|
|
|
| IPAIR | NAME | SHIFT | NEWSHIFT | S/N | NAME | SHIFT | NEWSHIFT | S/N |
| 0 | 08220039 | 2.03488 | 0.00000 | 17.8369 | 08220034 | 0.507537 | 1.52734 | 18.1801 |
| 1 | 08220040 | 1.50858 | 0.526300 | 18.5084 | 08220033 | 0.00000 | 2.03488 | 18.1981 |
| 2 | 08220038 | 2.03487 | 1.00136e-05 | 17.2925 | 08220037 | 1.50249 | 0.532390 | 17.9850 |