| Red | Green | Blue | |
| z | 17.64 | ||
| znorm | Inf | ||
| sky | -Inf | -Inf | -Inf |
| S/N | 20.4 | 37.0 | 39.6 |
| S/N(c) | 0.0 | 0.0 | 0.0 |
| SN(E/C) |


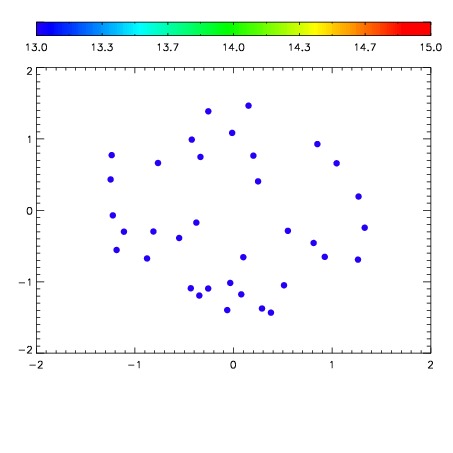

| Frame | Nreads | Zeropoints | Mag plots | Spatial mag deviation | Spatial sky 16325A emission deviations (filled: sky, open: star) | Spatial sky continuum emission | Spatial sky telluric CO2 absorption deviations (filled: H < 10) | |||||||||||||||||||||||
| 0 | 0 |
|
|
|
|
|
|
| IPAIR | NAME | SHIFT | NEWSHIFT | S/N | NAME | SHIFT | NEWSHIFT | S/N |
| 0 | 08710034 | 0.473055 | 0.00000 | 18.5514 | 08710033 | 0.00000 | 0.473055 | 18.4369 |
| 1 | 08710038 | 0.467545 | 0.00551000 | 18.8763 | 08710037 | -0.000350789 | 0.473406 | 18.8298 |
| 2 | 08710039 | 0.467592 | 0.00546300 | 18.7360 | 08710036 | 0.000552644 | 0.472502 | 18.8017 |
| 3 | 08710035 | 0.472956 | 9.90033e-05 | 18.7332 | 08710040 | -0.00495515 | 0.478010 | 18.7287 |