| Red | Green | Blue | |
| z | 17.64 | ||
| znorm | Inf | ||
| sky | -Inf | -Inf | -NaN |
| S/N | 23.1 | 40.0 | 45.4 |
| S/N(c) | 0.0 | 0.0 | 0.0 |
| SN(E/C) |
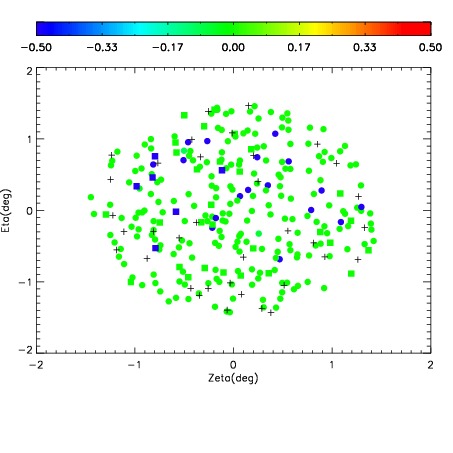
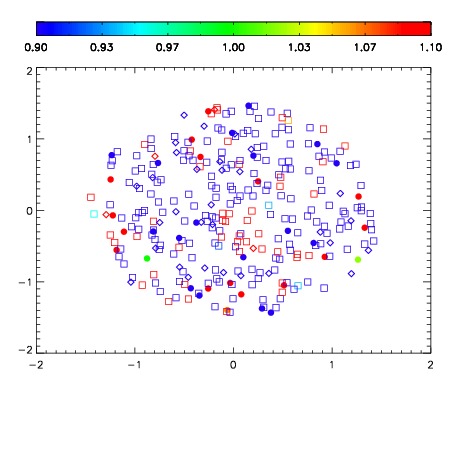


| Frame | Nreads | Zeropoints | Mag plots | Spatial mag deviation | Spatial sky 16325A emission deviations (filled: sky, open: star) | Spatial sky continuum emission | Spatial sky telluric CO2 absorption deviations (filled: H < 10) | |||||||||||||||||||||||
| 0 | 0 |
|
|
|
|
|
|
| IPAIR | NAME | SHIFT | NEWSHIFT | S/N | NAME | SHIFT | NEWSHIFT | S/N |
| 0 | 09070031 | 0.480877 | 0.00000 | 19.0086 | 09070029 | 0.00413306 | 0.476744 | 19.0584 |
| 1 | 09070030 | 0.480819 | 5.80251e-05 | 19.0055 | 09070028 | 0.00409260 | 0.476784 | 19.0402 |
| 2 | 09070027 | 0.360040 | 0.120837 | 19.0019 | 09070032 | 0.00389914 | 0.476978 | 19.0224 |
| 3 | 09070026 | 0.294910 | 0.185967 | 18.9965 | 09070025 | 0.00000 | 0.480877 | 18.9883 |