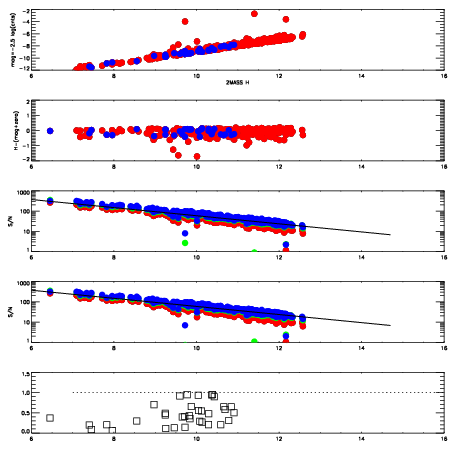
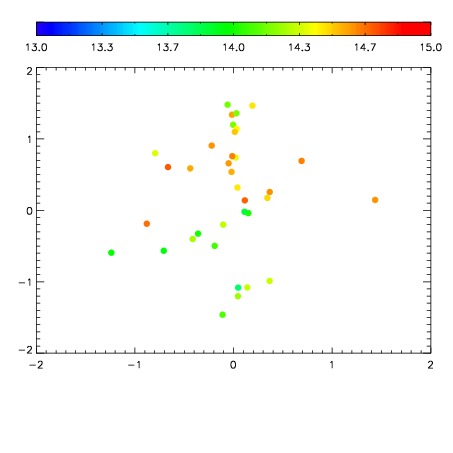
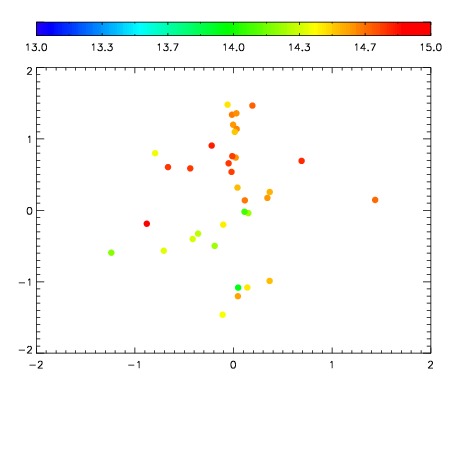
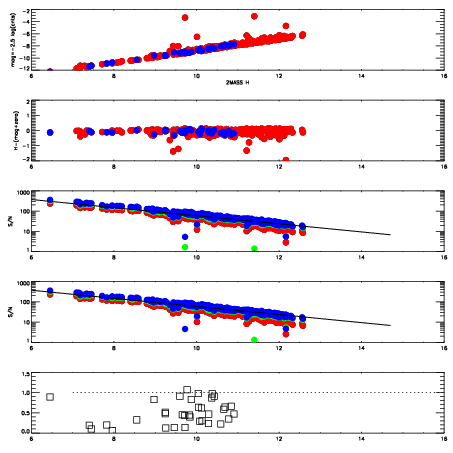
| Frame | Nreads | Zeropoints | Mag plots
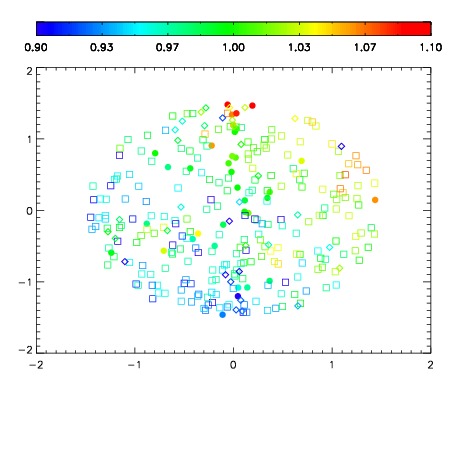
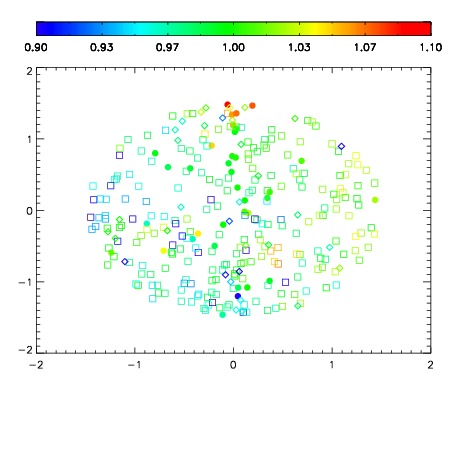
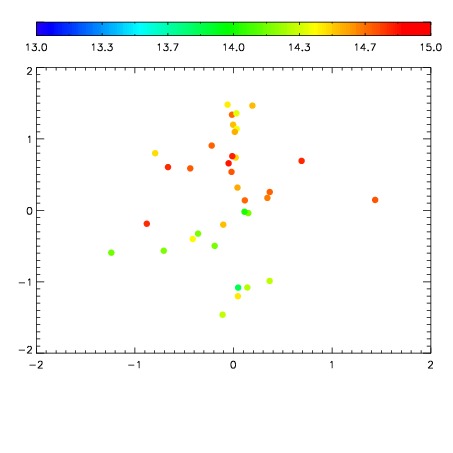
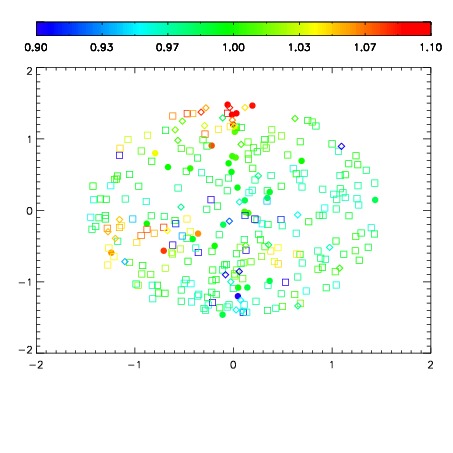
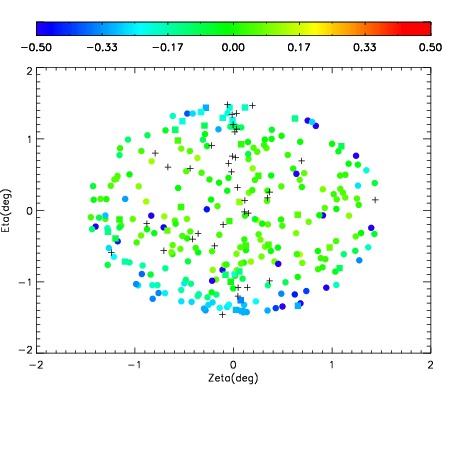
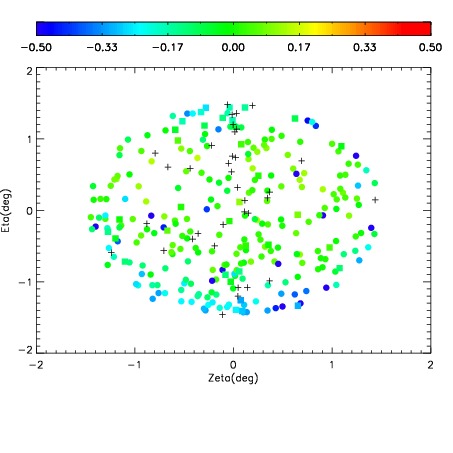
| Spatial mag deviation
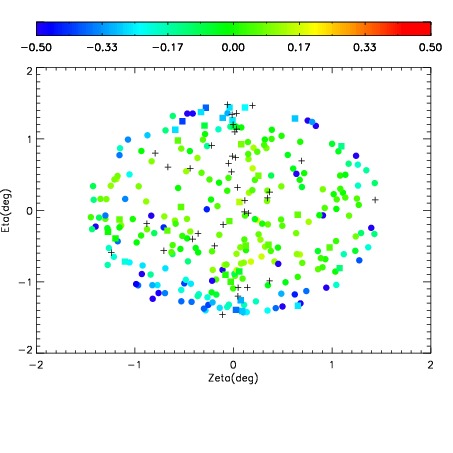
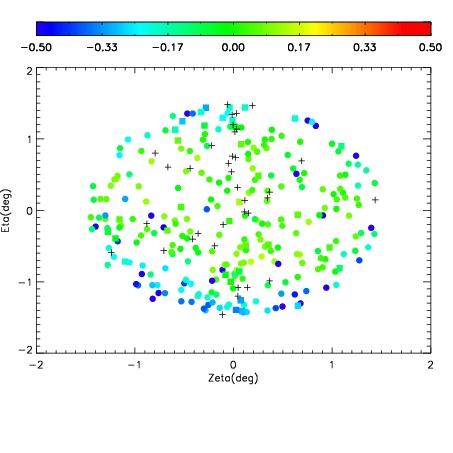
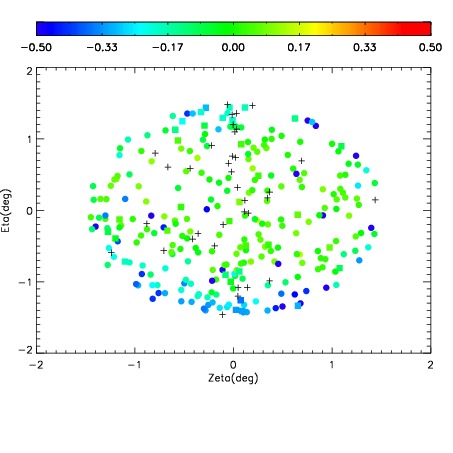
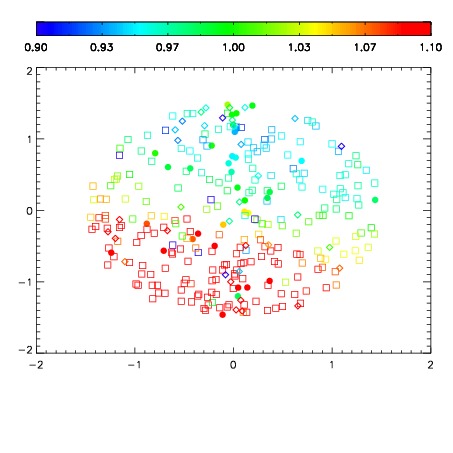
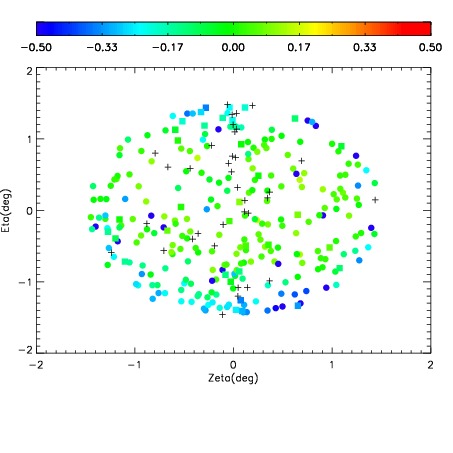
| Spatial sky 16325A emission deviations (filled: sky, open: star)
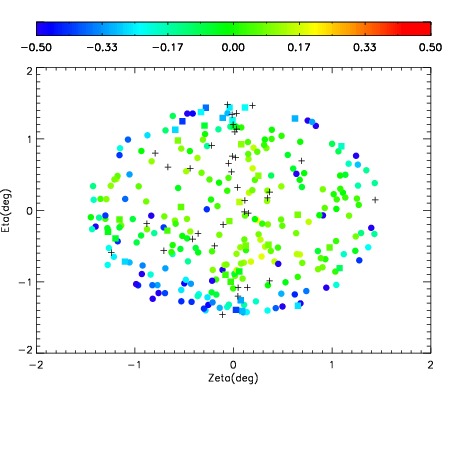
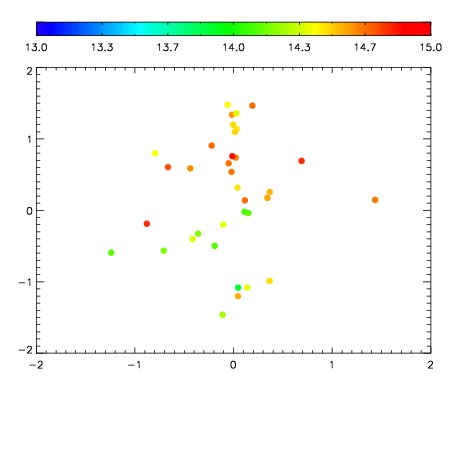
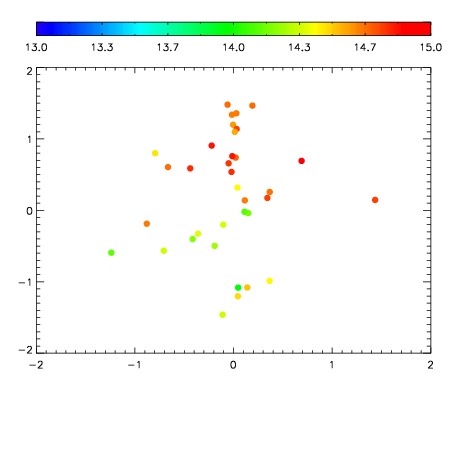
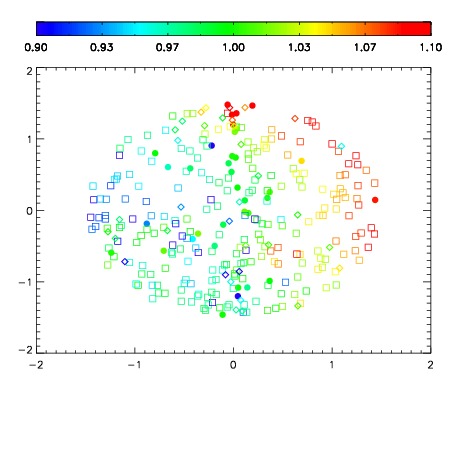
| Spatial sky continuum emission
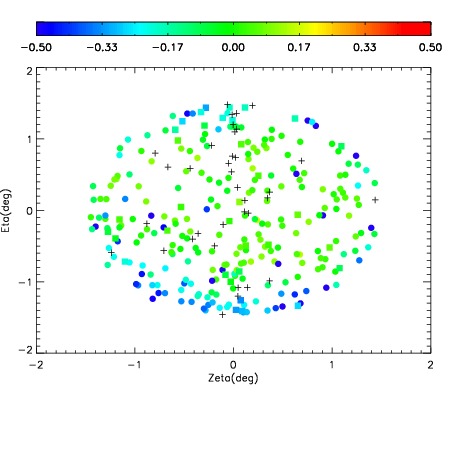
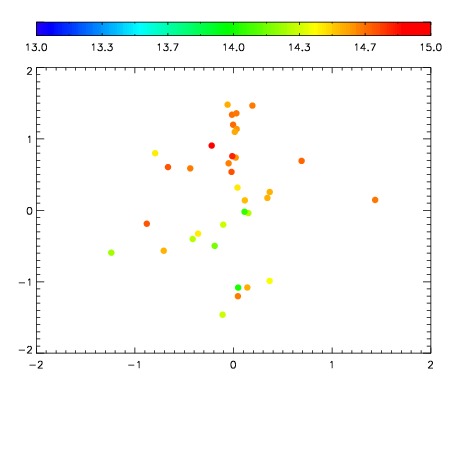
| Spatial sky telluric CO2 absorption deviations (filled: H < 10)
|
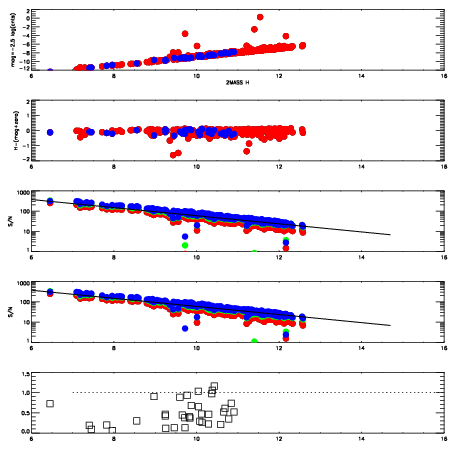
| 7890083
| 47
| | Red | Green | Blue
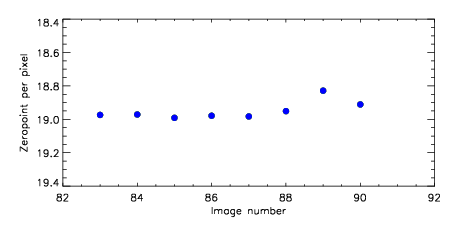
| | z | | 18.97
| | znorm | | 14.79
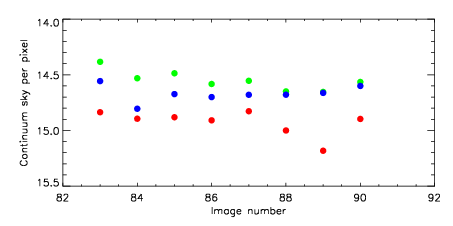
| | sky | 14.8 | 14.4 | 14.6
| | S/N | 15.5 | 24.0 | 24.8
| | S/N(c) | 12.5 | 5.8 | 10.0
| | SN(E/C) 0.43
|
| 
| 
| 
| 
| 
|
| 7890084
| 47
| | Red | Green | Blue
| | z | | 18.97
| | znorm | | 14.79
| | sky | 14.9 | 14.5 | 14.8
| | S/N | 15.3 | 24.0 | 25.0
| | S/N(c) | 12.6 | 5.8 | 10.2
| | SN(E/C) 0.42
|
| 
| 
| 
| 
| 
|
| 7890085
| 47
| | Red | Green | Blue
| | z | | 18.99
| | znorm | | 14.81
| | sky | 14.9 | 14.5 | 14.7
| | S/N | 15.5 | 24.0 | 25.6
| | S/N(c) | 12.8 | 5.9 | 10.4
| | SN(E/C) 0.44
|
| 
| 
| 
| 
| 
|
| 7890086
| 47
| | Red | Green | Blue
| | z | | 18.98
| | znorm | | 14.80
| | sky | 14.9 | 14.6 | 14.7
| | S/N | 15.5 | 23.9 | 25.5
| | S/N(c) | 12.6 | 5.9 | 10.3
| | SN(E/C) 0.42
|
| 
| 
| 
| 
| 
|
| 7890087
| 47
| | Red | Green | Blue
| | z | | 18.98
| | znorm | | 14.80
| | sky | 14.8 | 14.6 | 14.7
| | S/N | 15.3 | 23.6 | 25.7
| | S/N(c) | 12.6 | 5.8 | 10.5
| | SN(E/C) 0.44
|
| 
| 
| 
| 
| 
|
| 7890088
| 47
| | Red | Green | Blue
| | z | | 18.95
| | znorm | | 14.77
| | sky | 15.0 | 14.6 | 14.7
| | S/N | 15.1 | 23.4 | 25.5
| | S/N(c) | 12.3 | 5.7 | 10.1
| | SN(E/C) 0.45
|
| 
| 
| 
| 
| 
|
| 7890089
| 47
| | Red | Green | Blue
| | z | | 18.83
| | znorm | | 14.65
| | sky | 15.2 | 14.7 | 14.7
| | S/N | 13.8 | 21.6 | 24.0
| | S/N(c) | 12.0 | 5.4 | 9.7
| | SN(E/C) 0.47
|
| 
| 
| 
| 
| 
|
| 7890090
| 47
| | Red | Green | Blue
| | z | | 18.91
| | znorm | | 14.73
| | sky | 14.9 | 14.6 | 14.6
| | S/N | 14.7 | 22.6 | 25.3
| | S/N(c) | 12.6 | 5.6 | 10.2
| | SN(E/C) 0.43
|
| 
| 
| 
| 
| 
|