| Red | Green | Blue | |
| z | 17.64 | ||
| znorm | Inf | ||
| sky | -NaN | -NaN | -Inf |
| S/N | 24.7 | 41.5 | 46.0 |
| S/N(c) | 0.0 | 0.0 | 0.0 |
| SN(E/C) |
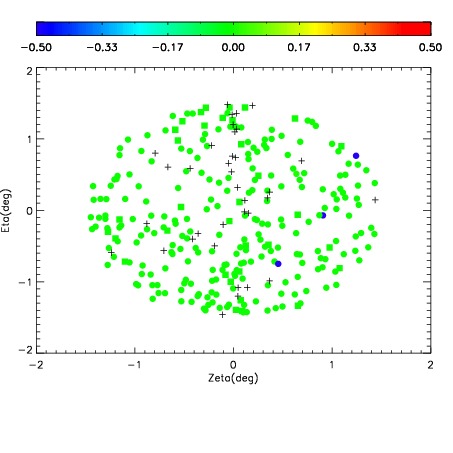
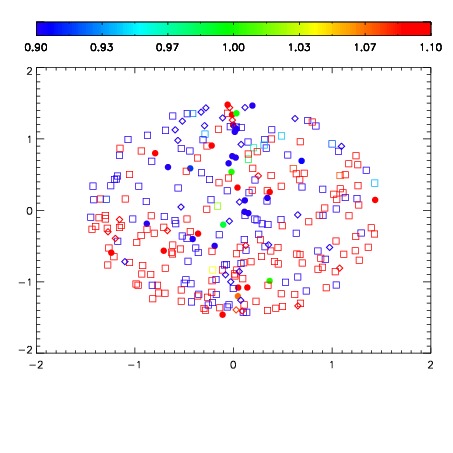
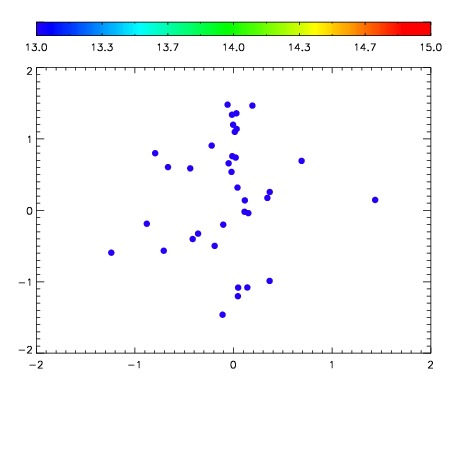

| Frame | Nreads | Zeropoints | Mag plots | Spatial mag deviation | Spatial sky 16325A emission deviations (filled: sky, open: star) | Spatial sky continuum emission | Spatial sky telluric CO2 absorption deviations (filled: H < 10) | |||||||||||||||||||||||
| 0 | 0 |
|
|
|
|
|
|
| IPAIR | NAME | SHIFT | NEWSHIFT | S/N | NAME | SHIFT | NEWSHIFT | S/N |
| 0 | 07890088 | 0.470412 | 0.00000 | 18.9370 | 07890083 | 0.00000 | 0.470412 | 18.9494 |
| 1 | 07890085 | 0.469536 | 0.000875980 | 18.9744 | 07890087 | 0.00112857 | 0.469283 | 18.9635 |
| 2 | 07890084 | 0.468644 | 0.00176799 | 18.9650 | 07890086 | 0.00101553 | 0.469396 | 18.9584 |
| 3 | 07890089 | 0.469874 | 0.000537992 | 18.8206 | 07890090 | 0.00262984 | 0.467782 | 18.8986 |