| Red | Green | Blue | |
| z | 17.64 | ||
| znorm | Inf | ||
| sky | -Inf | -NaN | -Inf |
| S/N | 19.8 | 35.0 | 37.9 |
| S/N(c) | 0.0 | 0.0 | 0.0 |
| SN(E/C) |
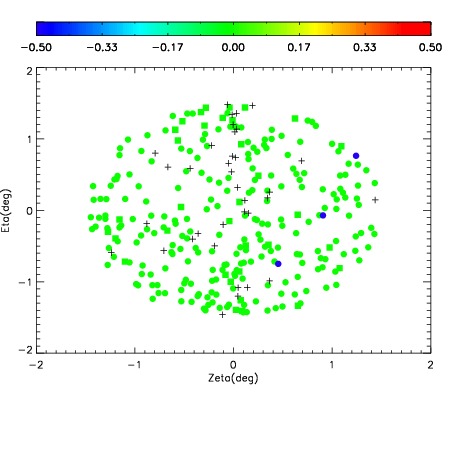
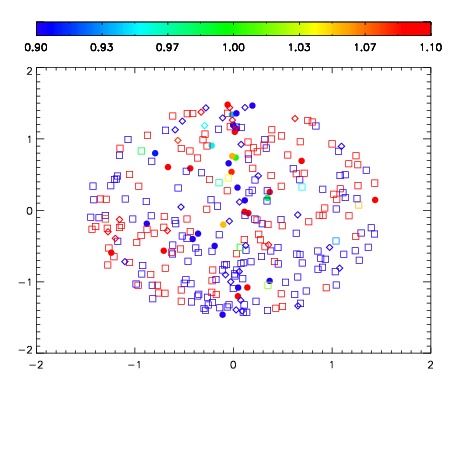


| Frame | Nreads | Zeropoints | Mag plots | Spatial mag deviation | Spatial sky 16325A emission deviations (filled: sky, open: star) | Spatial sky continuum emission | Spatial sky telluric CO2 absorption deviations (filled: H < 10) | |||||||||||||||||||||||
| 0 | 0 |
|
|
|
|
|
|
| IPAIR | NAME | SHIFT | NEWSHIFT | S/N | NAME | SHIFT | NEWSHIFT | S/N |
| 0 | 08440037 | 0.485686 | 0.00000 | 18.6393 | 08440043 | -0.00397919 | 0.489665 | 18.6472 |
| 1 | 08440042 | 0.484011 | 0.00167501 | 18.6544 | 08440036 | 0.00000 | 0.485686 | 18.6543 |
| 2 | 08440041 | 0.483498 | 0.00218800 | 18.5907 | 08440040 | -0.00356725 | 0.489253 | 18.5905 |
| 3 | 08440038 | 0.484731 | 0.000955015 | 18.5719 | 08440039 | 0.00217013 | 0.483516 | 18.5481 |