| Red | Green | Blue | |
| z | 17.64 | ||
| znorm | Inf | ||
| sky | -NaN | -NaN | -Inf |
| S/N | 24.2 | 42.7 | 46.3 |
| S/N(c) | 0.0 | 0.0 | 0.0 |
| SN(E/C) |
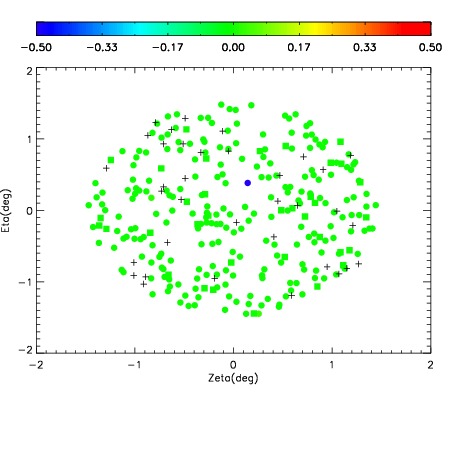

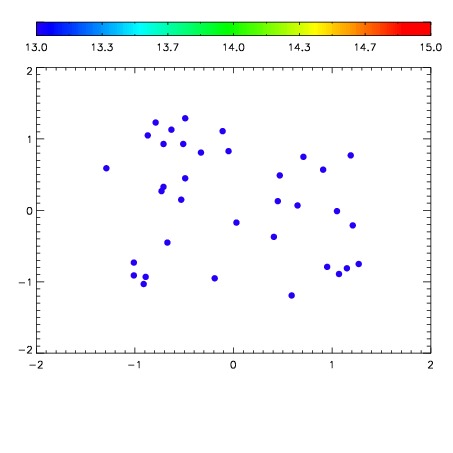

| Frame | Nreads | Zeropoints | Mag plots | Spatial mag deviation | Spatial sky 16325A emission deviations (filled: sky, open: star) | Spatial sky continuum emission | Spatial sky telluric CO2 absorption deviations (filled: H < 10) | |||||||||||||||||||||||
| 0 | 0 |
|
|
|
|
|
|
| IPAIR | NAME | SHIFT | NEWSHIFT | S/N | NAME | SHIFT | NEWSHIFT | S/N |
| 0 | 07870092 | 0.469041 | 0.00000 | 18.9098 | 07870086 | 0.00000 | 0.469041 | 18.9008 |
| 1 | 07870088 | 0.465819 | 0.00322199 | 18.9838 | 07870090 | 0.000650849 | 0.468390 | 19.0202 |
| 2 | 07870087 | 0.465789 | 0.00325200 | 18.9797 | 07870089 | 0.00181653 | 0.467224 | 18.9638 |
| 3 | 07870091 | 0.467827 | 0.00121400 | 18.9722 | 07870093 | 0.00667622 | 0.462365 | 18.9445 |