| Red | Green | Blue | |
| z | 17.64 | ||
| znorm | Inf | ||
| sky | -Inf | -NaN | -Inf |
| S/N | 19.6 | 35.1 | 36.8 |
| S/N(c) | 0.0 | 0.0 | 0.0 |
| SN(E/C) |
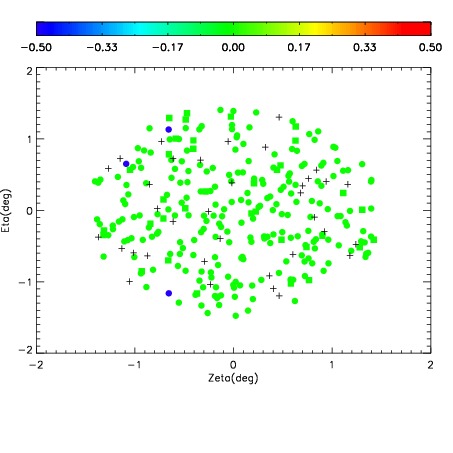
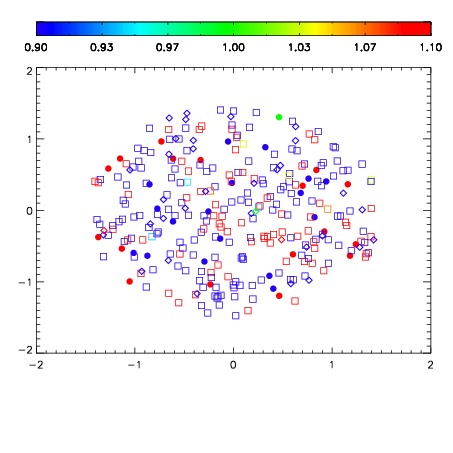
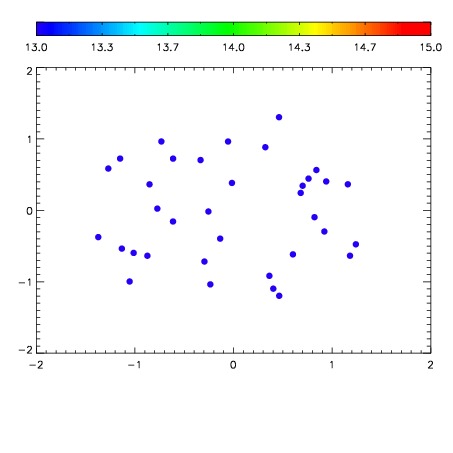

| Frame | Nreads | Zeropoints | Mag plots | Spatial mag deviation | Spatial sky 16325A emission deviations (filled: sky, open: star) | Spatial sky continuum emission | Spatial sky telluric CO2 absorption deviations (filled: H < 10) | |||||||||||||||||||||||
| 0 | 0 |
|
|
|
|
|
|
| IPAIR | NAME | SHIFT | NEWSHIFT | S/N | NAME | SHIFT | NEWSHIFT | S/N |
| 0 | 07620064 | 0.485042 | 0.00000 | 18.7193 | 07620062 | 0.00281937 | 0.482223 | 18.9173 |
| 1 | 07620061 | 0.482688 | 0.00235400 | 18.7489 | 07620059 | 0.00000 | 0.485042 | 18.9594 |
| 2 | 07620060 | 0.483016 | 0.00202599 | 18.6177 | 07620063 | 0.00145625 | 0.483586 | 18.8134 |