| Red | Green | Blue | |
| z | 17.64 | ||
| znorm | Inf | ||
| sky | -Inf | -Inf | -Inf |
| S/N | 26.0 | 45.8 | 50.6 |
| S/N(c) | 0.0 | 0.0 | 0.0 |
| SN(E/C) |

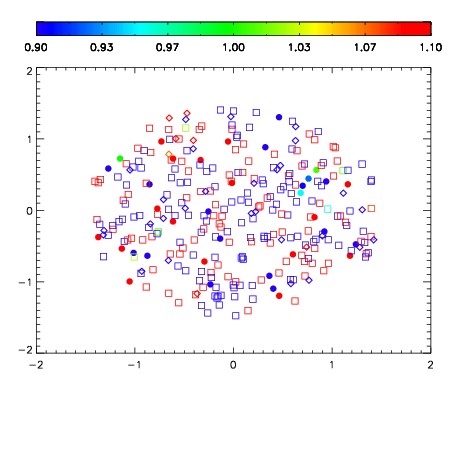


| Frame | Nreads | Zeropoints | Mag plots | Spatial mag deviation | Spatial sky 16325A emission deviations (filled: sky, open: star) | Spatial sky continuum emission | Spatial sky telluric CO2 absorption deviations (filled: H < 10) | |||||||||||||||||||||||
| 0 | 0 |
|
|
|
|
|
|
| IPAIR | NAME | SHIFT | NEWSHIFT | S/N | NAME | SHIFT | NEWSHIFT | S/N |
| 0 | 07850083 | 0.465235 | 0.00000 | 18.8910 | 07850081 | 0.00000 | 0.465235 | 18.8916 |
| 1 | 07850086 | 0.463076 | 0.00215900 | 18.9358 | 07850085 | -0.00201236 | 0.467247 | 18.9691 |
| 2 | 07850087 | 0.463295 | 0.00193998 | 18.9306 | 07850088 | -0.00277772 | 0.468013 | 18.9663 |
| 3 | 07850082 | 0.464360 | 0.000874996 | 18.8928 | 07850084 | 0.000588586 | 0.464646 | 18.9199 |