| Red | Green | Blue | |
| z | 17.64 | ||
| znorm | Inf | ||
| sky | -Inf | -Inf | -Inf |
| S/N | 21.3 | 37.9 | 39.6 |
| S/N(c) | 0.0 | 0.0 | 0.0 |
| SN(E/C) |
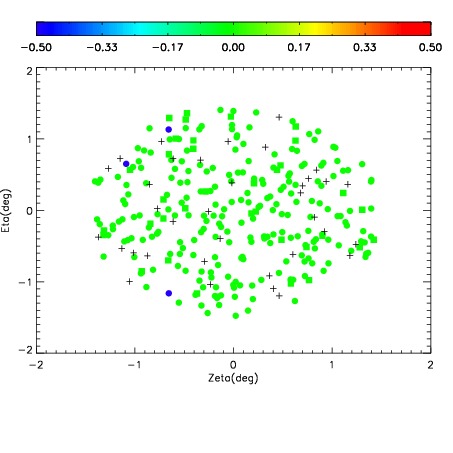
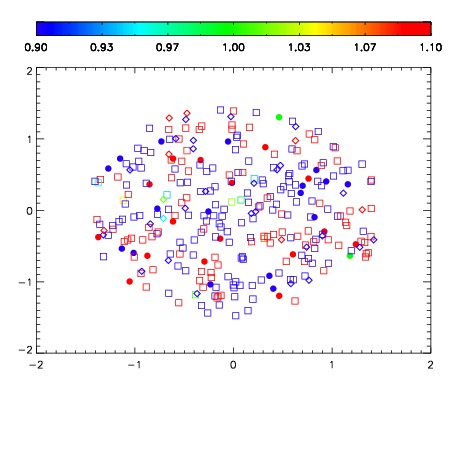


| Frame | Nreads | Zeropoints | Mag plots | Spatial mag deviation | Spatial sky 16325A emission deviations (filled: sky, open: star) | Spatial sky continuum emission | Spatial sky telluric CO2 absorption deviations (filled: H < 10) | |||||||||||||||||||||||
| 0 | 0 |
|
|
|
|
|
|
| IPAIR | NAME | SHIFT | NEWSHIFT | S/N | NAME | SHIFT | NEWSHIFT | S/N |
| 0 | 07900064 | 0.466966 | 0.00000 | 18.5534 | 07900063 | -0.00272295 | 0.469689 | 18.5838 |
| 1 | 07900060 | 0.463732 | 0.00323400 | 18.7338 | 07900066 | -0.00138859 | 0.468355 | 18.7896 |
| 2 | 07900065 | 0.466549 | 0.000416994 | 18.6667 | 07900062 | -0.00235223 | 0.469318 | 18.7394 |
| 3 | 07900061 | 0.464871 | 0.00209501 | 18.6281 | 07900059 | 0.00000 | 0.466966 | 18.7325 |