| Red | Green | Blue | |
| z | 17.64 | ||
| znorm | Inf | ||
| sky | -Inf | -Inf | -Inf |
| S/N | 24.7 | 45.8 | 49.3 |
| S/N(c) | 0.0 | 0.0 | 0.0 |
| SN(E/C) |


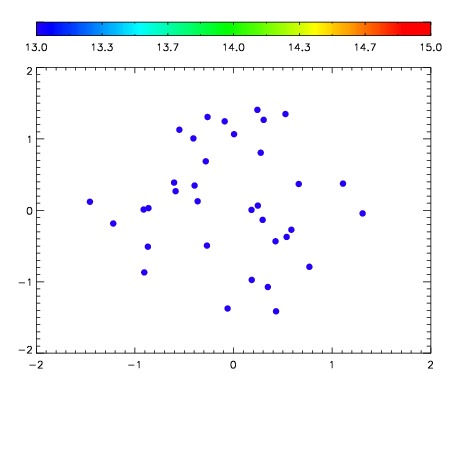

| Frame | Nreads | Zeropoints | Mag plots | Spatial mag deviation | Spatial sky 16325A emission deviations (filled: sky, open: star) | Spatial sky continuum emission | Spatial sky telluric CO2 absorption deviations (filled: H < 10) | |||||||||||||||||||||||
| 0 | 0 |
|
|
|
|
|
|
| IPAIR | NAME | SHIFT | NEWSHIFT | S/N | NAME | SHIFT | NEWSHIFT | S/N |
| 0 | 07910066 | 0.505240 | 0.00000 | 19.0290 | 07910067 | 0.000849020 | 0.504391 | 19.0132 |
| 1 | 07910065 | 0.501995 | 0.00324500 | 19.0842 | 07910060 | 0.00000 | 0.505240 | 19.0998 |
| 2 | 07910061 | 0.500563 | 0.00467700 | 19.0468 | 07910064 | -0.000857276 | 0.506097 | 19.0736 |
| 3 | 07910062 | 0.503916 | 0.00132400 | 19.0024 | 07910063 | 0.000140480 | 0.505100 | 18.9779 |