| Red | Green | Blue | |
| z | 17.64 | ||
| znorm | Inf | ||
| sky | -Inf | -Inf | -NaN |
| S/N | 28.1 | 48.7 | 52.7 |
| S/N(c) | 0.0 | 0.0 | 0.0 |
| SN(E/C) |
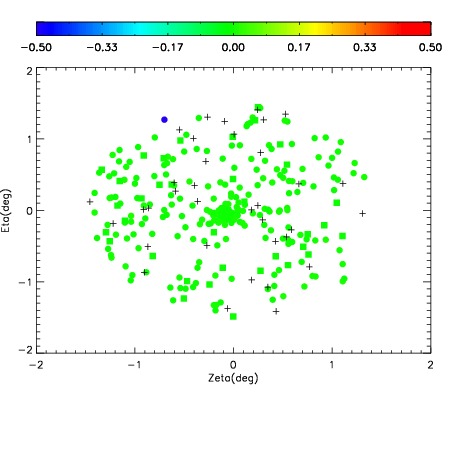

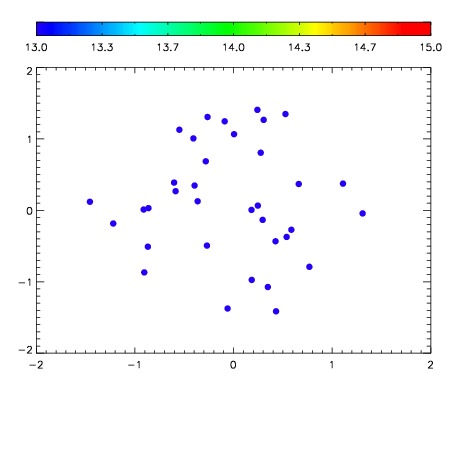

| Frame | Nreads | Zeropoints | Mag plots | Spatial mag deviation | Spatial sky 16325A emission deviations (filled: sky, open: star) | Spatial sky continuum emission | Spatial sky telluric CO2 absorption deviations (filled: H < 10) | |||||||||||||||||||||||
| 0 | 0 |
|
|
|
|
|
|
| IPAIR | NAME | SHIFT | NEWSHIFT | S/N | NAME | SHIFT | NEWSHIFT | S/N |
| 0 | 08210034 | 0.510212 | 0.00000 | 19.0906 | 08210033 | 0.00000 | 0.510212 | 18.9106 |
| 1 | 08210039 | 0.508832 | 0.00138003 | 19.1820 | 08210037 | -0.00258970 | 0.512802 | 19.1799 |
| 2 | 08210038 | 0.510135 | 7.70092e-05 | 19.1616 | 08210040 | -0.00210721 | 0.512319 | 19.1654 |
| 3 | 08210035 | 0.510197 | 1.50204e-05 | 19.1561 | 08210036 | -0.000949205 | 0.511161 | 19.1478 |