| Red | Green | Blue | |
| z | 17.64 | ||
| znorm | Inf | ||
| sky | -Inf | -Inf | -NaN |
| S/N | 25.5 | 42.8 | 47.5 |
| S/N(c) | 0.0 | 0.0 | 0.0 |
| SN(E/C) |
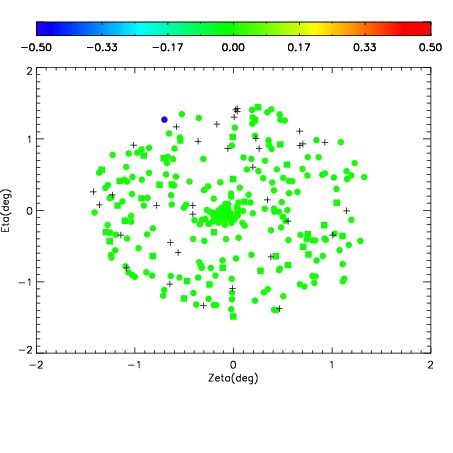
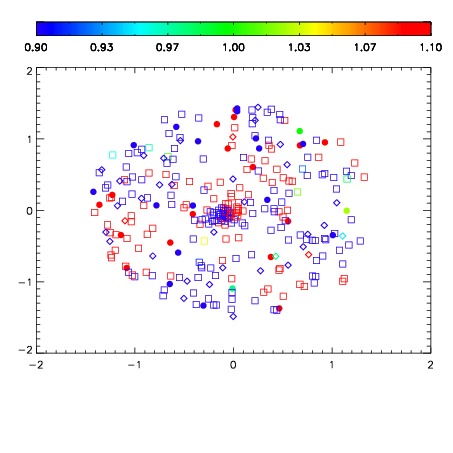
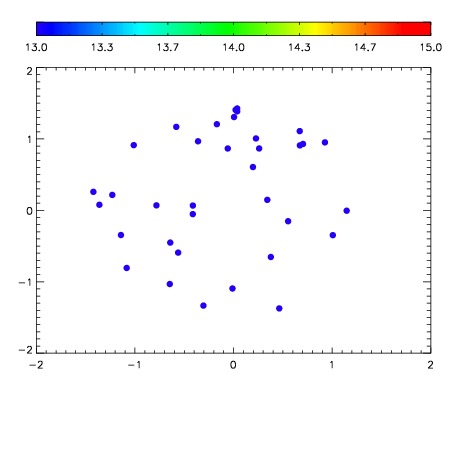

| Frame | Nreads | Zeropoints | Mag plots | Spatial mag deviation | Spatial sky 16325A emission deviations (filled: sky, open: star) | Spatial sky continuum emission | Spatial sky telluric CO2 absorption deviations (filled: H < 10) | |||||||||||||||||||||||
| 0 | 0 |
|
|
|
|
|
|
| IPAIR | NAME | SHIFT | NEWSHIFT | S/N | NAME | SHIFT | NEWSHIFT | S/N |
| 0 | 08220028 | 0.507920 | 0.00000 | 18.8035 | 08220029 | 0.000452701 | 0.507467 | 18.8531 |
| 1 | 08220027 | 0.506789 | 0.00113100 | 19.0875 | 08220025 | -0.00144152 | 0.509362 | 19.0023 |
| 2 | 08220024 | 0.507634 | 0.000286043 | 18.8981 | 08220026 | -0.000446661 | 0.508367 | 18.9996 |
| 3 | 08220023 | 0.507609 | 0.000311017 | 18.8025 | 08220022 | 0.00000 | 0.507920 | 18.8248 |