| Red | Green | Blue | |
| z | 17.64 | ||
| znorm | Inf | ||
| sky | -NaN | -NaN | -Inf |
| S/N | 25.9 | 44.6 | 50.5 |
| S/N(c) | 0.0 | 0.0 | 0.0 |
| SN(E/C) |
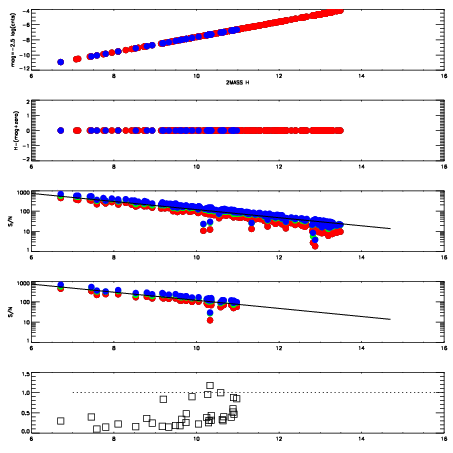
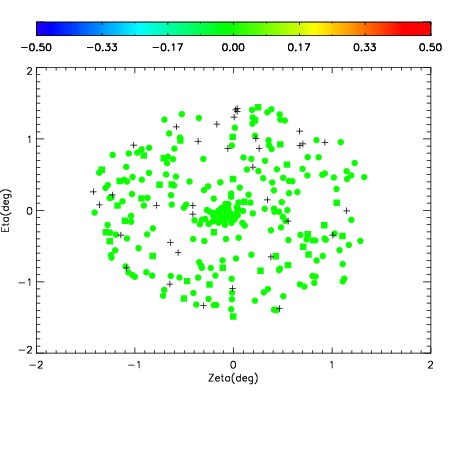
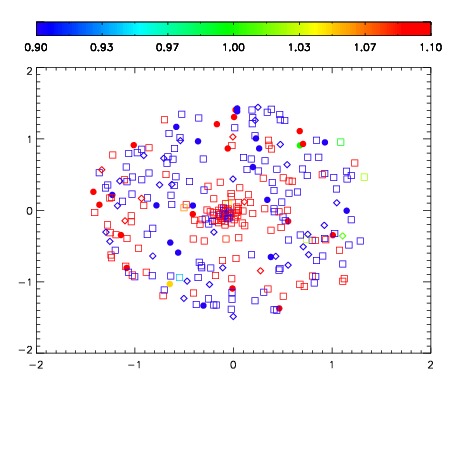
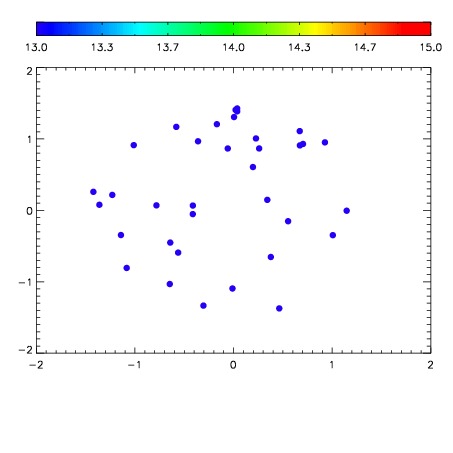

| Frame | Nreads | Zeropoints | Mag plots | Spatial mag deviation | Spatial sky 16325A emission deviations (filled: sky, open: star) | Spatial sky continuum emission | Spatial sky telluric CO2 absorption deviations (filled: H < 10) | |||||||||||||||||||||||
| 0 | 0 |
|
|
|
|
|
|
| IPAIR | NAME | SHIFT | NEWSHIFT | S/N | NAME | SHIFT | NEWSHIFT | S/N |
| 0 | 08410060 | 0.505709 | 0.00000 | 19.0986 | 08410062 | 0.00153688 | 0.504172 | 19.0900 |
| 1 | 08410061 | 0.504735 | 0.000974000 | 19.1174 | 08410063 | 0.00136289 | 0.504346 | 19.0925 |
| 2 | 08410064 | 0.502120 | 0.00358897 | 19.0583 | 08410059 | 0.00000 | 0.505709 | 19.0607 |
| 3 | 08410065 | 0.502859 | 0.00285000 | 19.0001 | 08410066 | 0.00148994 | 0.504219 | 18.9714 |