| Frame | Nreads | Zeropoints | Mag plots
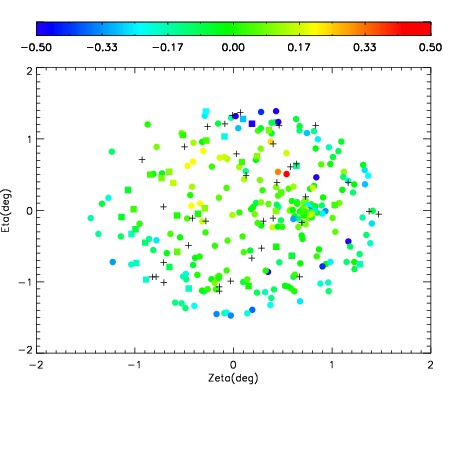
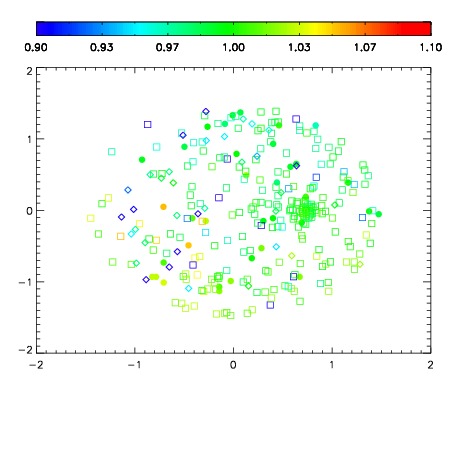
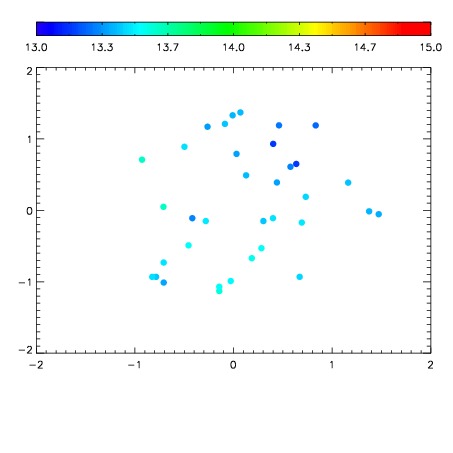
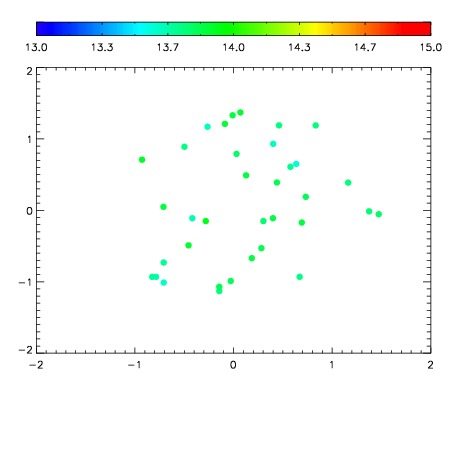
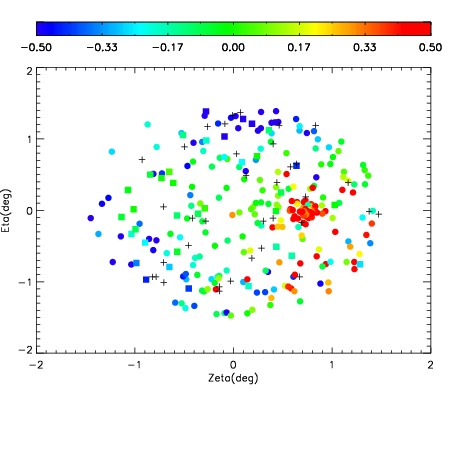
| Spatial mag deviation
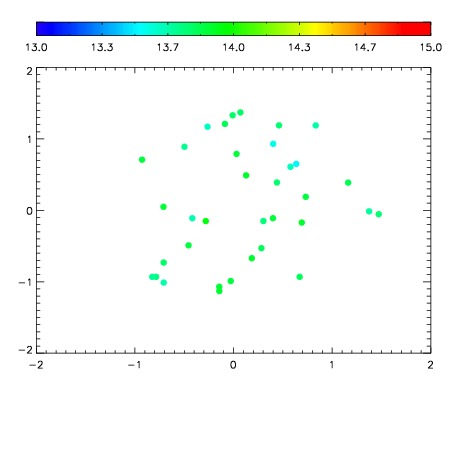
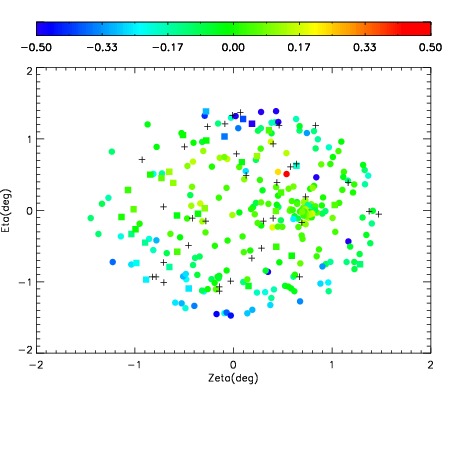
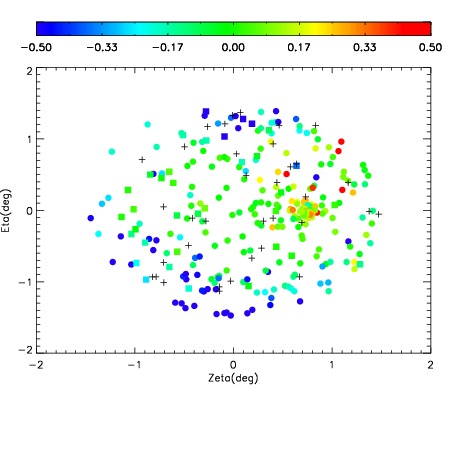
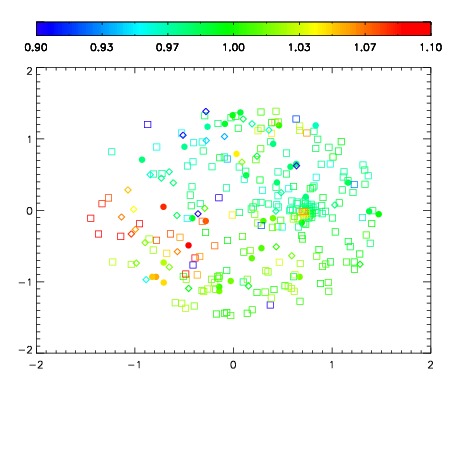
| Spatial sky 16325A emission deviations (filled: sky, open: star)
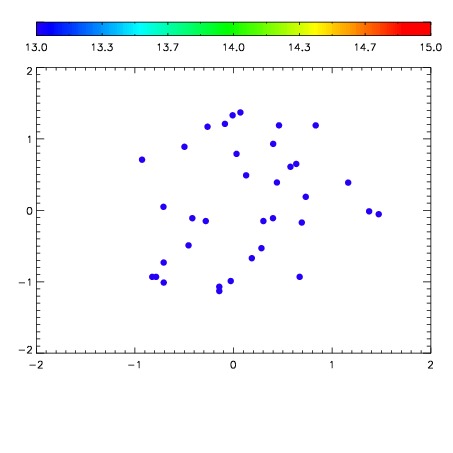
| Spatial sky continuum emission
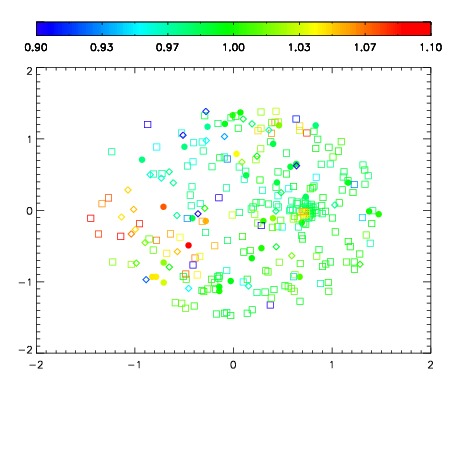
| Spatial sky telluric CO2 absorption deviations (filled: H < 10)
|
| 12870004
| 47
| | Red | Green | Blue
| | z | | 18.88
| | znorm | | 14.70
| | sky | 13.6 | 13.6 | 13.5
| | S/N | 12.0 | 20.5 | 21.1
| | S/N(c) | 20.6 | 32.4 | 45.3
| | SN(E/C) 0.70
|
| 
| 
| 
| 
| 
|
| 12870005
| 47
| | Red | Green | Blue
| | z | | 18.90
| | znorm | | 14.72
| | sky | 13.8 | 13.8 | 13.8
| | S/N | 11.5 | 20.3 | 21.2
| | S/N(c) | 20.5 | 33.0 | 45.7
| | SN(E/C) 0.70
|
| 
| 
| 
| 
| 
|
| 12870006
| 47
| | Red | Green | Blue
| | z | | 18.84
| | znorm | | 14.66
| | sky | 13.5 | 13.4 | 13.4
| | S/N | 10.6 | 18.8 | 19.8
| | S/N(c) | 19.6 | 32.3 | 43.8
| | SN(E/C) 0.72
|
| 
| 
| 
| 
| 
|
| 12870007
| 47
| | Red | Green | Blue
| | z | | 18.73
| | znorm | | 14.55
| | sky | 13.3 | 13.3 | 13.3
| | S/N | 9.5 | 17.0 | 17.7
| | S/N(c) | 18.1 | 29.9 | 40.8
| | SN(E/C) 0.73
|
| 
| 
| 
| 
| 
|
| 12870008
| 47
| | Red | Green | Blue
| | z | | 18.74
| | znorm | | 14.56
| | sky | 13.9 | 13.8 | 13.8
| | S/N | 10.3 | 18.3 | 19.2
| | S/N(c) | 18.3 | 30.8 | 42.1
| | SN(E/C) 0.65
|
| 
| 
| 
| 
| 
|
| 12870009
| 47
| | Red | Green | Blue
| | z | | 18.77
| | znorm | | 14.59
| | sky | 12.7 | 12.7 | 12.7
| | S/N | 9.4 | 15.5 | 15.6
| | S/N(c) | 16.9 | 28.1 | 38.8
| | SN(E/C) 0.72
|
| 
| 
| 
| 
| 
|
| 12870010
| 47
| | Red | Green | Blue
| | z | | 18.55
| | znorm | | 14.37
| | sky | 12.4 | 12.4 | 12.4
| | S/N | 8.8 | 14.7 | 15.3
| | S/N(c) | 13.5 | 23.5 | 32.3
| | SN(E/C) 0.81
|
| 
| 
| 
| 
| 
|
| 12870011
| 47
| | Red | Green | Blue
| | z | | 18.67
| | znorm | | 14.49
| | sky | 12.9 | 12.8 | 12.9
| | S/N | 8.2 | 14.4 | 14.3
| | S/N(c) | 16.3 | 27.7 | 39.0
| | SN(E/C) 0.77
|
| 
| 
| 
| 
| 
|